June is Debunk Learning Styles Month in the learning field!

One of the most ubiquitous myths in the world today, learning styles has risen to a crescendo within the workplace learning field and in education as well. The idea is that if you diagnose learners on their learning styles and then tailor learning methods to the different style — that learning results will improve.

It’s a widespread belief, but it’s actually false. Research evidence suggests that using learning styles to guide learning design does not improve learning results.

The good news is that there are several solid research reviews that demonstrate this. Indeed, The Debunker Club, which I organize, has compiled some excellent resources for folks who want to see the evidence.

To see The Debunker Club resource page on learning styles, click here.

To join The Debunker Club in debunking learning styles now (June 2015), click here.

To become a member of The Debunker Club, click here.


There’s too much crap floating around the learning and education fields; too many myths, misconceptions, and maladaptive learning designs. I started The Debunker Club and have been working to debunk myths for many years, so I’m passionate about the need for more debunking. The need is great and the danger to learning and learners is dire.

Fortunately, entering the world is a great new book by three researchers, Pedro De Bruyckere, Paul A. Kirschner, and Casper D. Hulshof. Their book is titled, Urban Myths about Learning and Education, and it’s jam packed with a list of 35 myths that plague our field.

You can buy it through Amazon by clicking the image below.


The book is sure to have a major impact in the education and training fields.

Partial List of Topics

Here is a list of the SOME of the myths they debunk*:

  • Learning styles
  • The bastardized version of Dale’s Cone
  • 70, 20, 10
  • No need for knowledge if we can look everything up
  • Discovery learning is best
  • Problem-based learning
  • School kills creativity
  • 93% of communication is non-verbal
  • We use only 10% of our brains
  • You can train your brain with brain games
  • We think most clearly when we’re under pressure
  • Neuroscience provides helpful recommendations
  • New technology is causing a revolution in education
  • The internet belongs on the classroom
  • The internet makes us dumber
  • Class size doesn’t matter

*Note that “debunk” doesn’t necessarily mean to rule out completely! Often the authors find supporting evidence for some of the claims, or partial evidence, or they highlight boundary conditions.

Quotes from the Book

To give you a sense of the book, here are some quotes:

On Learning Styles:

“Though appealing, no solid evidence exists showing that there is any benefit in adapting and designing education and instruction to these so-called styles. It may even  e the case that in doing so, administrators, teachers, parents and even learners are negatively influencing the learning process and the products of education and instruction.”


On the Too-Ready Belief in Neuroscience:

“In practice, at the moment it is only the insights of cognitive psychology [not neuropsychology] that can be effectively used in education, but even here care needs to be taken. Neurology has the potential to add value to education, but in general there are only two real conclusions we can make at present:

– For the time being, we do not really understand all that much about the brain.
– More importantly, it is difficult to generalize what we do know into a set of concrete precepts of behavior, never mind devise methods for influencing that behavior.”


On the 70-20-10 Rule

“Informal learning is certainly very important, but we could find no evidence in the scientific literature to support the ratio of 70% information learning, 20% learning from others, and 10% formal learning.”


On Problem-Based Learning

“The use of problem-based learning to learn new content does not have a positive learning effect. But there is a positive learning effect if you use problem-based learning to further explore and remember something that the learner already knows.”


On Class Size

“Some studies show that smaller classes are not necessarily better, but that is just a part of the story. The quality of the teachers seems to be more important than class size, but other studies do suggest that smaller classes also seem to have performed better.”

Strengths of the Book

  • After each of the 35 myths, the authors write a short conclusion that very clearly and succinctly sums up their findings. This is very helpful.
  • The 35 myths are almost all very well known and important issues that need a research-based commentary.
  • The authors appear to have done their homework in researching the topics in the book. Certainly in the areas of research that I know best, their findings are consistent with my reading of the research.
  • The authors weigh complicated evidence in a manner that is fair and thoughtful.

Weaknesses of the Book

  • While the authors have designed the book specifically to reach practitioners (teachers, trainers, instructional designers, professors, and other learning professionals), they too often fall into the trap of using research jargon, which will make it difficult for some of their intended audience to fully comprehend some of the finer points of the book.

To Buy the Book, or Not?

Absolutely! Buy the book now! Occasionally, you might have some trouble with the jargon, but the most important messages will come through loud and clear.

This is a great book to peruse in short bursts. Each myth has its own chapter, which can be quickly read and deciphered. A great book to keep on your desk, in the bathroom, or on your cell phone. I’m loving it on my phone’s Kindle reader.

You can buy it on Amazon right now.


The Danger

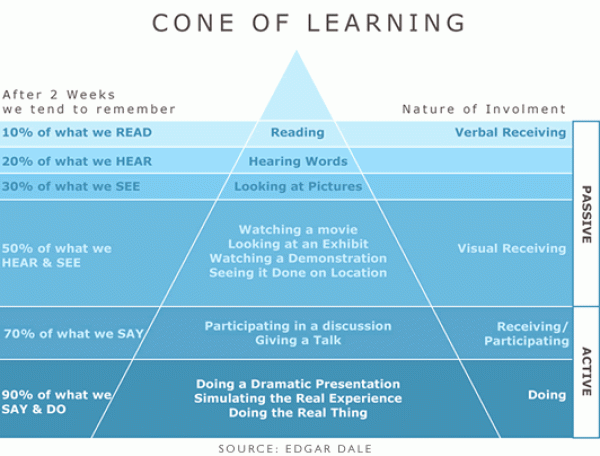
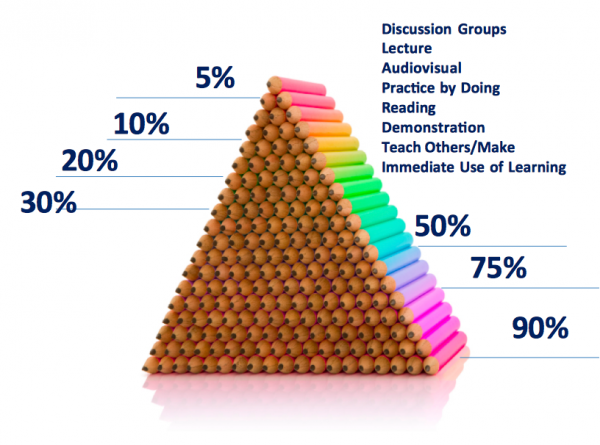
Have you ever seen the following “research” presented to demonstrate some truth about human learning?

Unfortunately, all of the above diagrams are evangelizing misleading information. Worse, these fabrications have been rampant over the last two or three decades—and seem to have accelerated during the age of the internet. Indeed, a Google image search for “Dale’s Cone” produces about 80% misleading information, as you can see below from a recent search.

Search 2015:


Search 2017:


This proliferation is a truly dangerous and heinous result of incompetence, deceit, confirmatory bias, greed, and other nefarious human tendencies.

It is also hurting learners throughout the world—and it must be stopped. Each of us has a responsibility in this regard.


New Research

Fortunately, a group of tireless researchers—who I’ve had the honor of collaborating with—has put a wooden stake through the dark heart of this demon. In the most recent addition of the scientific journal Educational Technology, Deepak Subramony, Michael Molenda, Anthony Betrus, and I (my contribution was small) produced four articles on the dangers of this misinformation and the genesis of it. After working separately over the years to debunk this bit of mythology, the four of us have come together in a joint effort to rally the troops—people like you, dedicated professionals who want to create the best outcomes for your learners.

Here are the citations for the four articles. Later, I will have a synopsis of each article.

Subramony, D., Molenda, M., Betrus, A., and Thalheimer, W. (2014). The Mythical Retention Chart and the Corruption of Dale’s Cone of Experience. Educational Technology, Nov/Dec 2014, 54(6), 6-16.

Subramony, D., Molenda, M., Betrus, A., and Thalheimer, W. (2014). Previous Attempts to Debunk the Mythical Retention Chart and Corrupted Dale’s Cone. Educational Technology, Nov/Dec 2014, 54(6), 17-21.

Subramony, D., Molenda, M., Betrus, A., and Thalheimer, W. (2014). The Good, the Bad, and the Ugly: A Bibliographic Essay on the Corrupted Cone. Educational Technology, Nov/Dec 2014, 54(6), 22-31.

Subramony, D., Molenda, M., Betrus, A., and Thalheimer, W. (2014). Timeline of the Mythical Retention Chart and Corrupted Dale’s Cone. Educational Technology, Nov/Dec 2014, 54(6), 31-24.

Many thanks to Lawrence Lipsitz, the editor of Educational Technology, for his support, encouragement, and efforts in making this possible!

To get a copy of the “Special Issue” or to subscribe to Educational Technology, go to this website. (Note, 2017: I don’t think the journal is being published anymore.)


The Background

There are two separate memes we are debunking, what we’ve labeled (1) the mythical retention chart and (2) the corruption of Dale’s Cone of Experience. As you will see—or might have noticed in the images I previously shared—the two have often be comingled.

Here is an example of the mythical retention chart:


Oftentimes though, this is presented in text:

“People Remember:

  • 10 percent of what they read;
  • 20 percent of what they hear;
  • 30 percent of what they see;
  • 50 percent of what they see and hear;
  • 70 percent of what they say; and
  • 90 percent of what they do and say

Note that the numbers proffered are not always the same, nor are the factors alleged to spur learning. So, for example, you can see that on the graphic, people are said to remember 30 percent of what they hear, but in the text, the percentage is 20 percent. In the graphic, people remember 80 percent when they are collaborating, but in the text they remember 70% of what they SAY. I’ve looked at hundreds of examples, and the variety is staggering.

Most importantly, the numbers do NOT provide good guidance for learning design, as I will detail later.

Here is a photocopied image of the original Dale’s Cone:

Edgar Dale (1900-1985) was an American educator who is best known for developing “Dale’s Cone of Experience” (the cone above) and for his work on how to incorporate audio-visual materials into the classroom learning experience. The image above was photocopied directly from his book, Audio-visual methods in teaching (from the 1969 edition).


You’ll note that Dale included no numbers in his cone. He also warned his readers not to take the cone too literally.

Unfortunately, someone somewhere decided to add the misleading numbers. Here are two more examples:


I include these two examples to make two points. First, note how one person clearly stole from the other one. Second, note how sloppy these fabricators are. They include a Confucius quote that directly contradicts what the numbers say. On the left side of the visuals, Confucius is purported to say that hearing is better than seeing, while the numbers on the right of the visuals say that seeing is better than hearing. And, by the way, Confucius did not actually say what he is being alleged to have said! What seems clear from looking at these and other examples is that people don’t do their due diligence—their ends seems to justify their means—and they are damn sloppy, suggesting that they don’t think their audiences will examine their arguments closely.

By the way, these deceptions are not restricted to the English-speaking world:


Intro to the Special Issue of Educational Technology

As Deepak Subramony and Michael Molenda say in the introduction to the Special Issue of Educational Technology, the four articles presented seek to provide a “comprehensive and complete analysis of the issues surrounding these tortured constructs.” They also provide “extensive supporting material necessary to present a comprehensive refutation of the aforementioned attempts to corrupt Dale’s original model.”

In the concluding notes to the introduction, Subramony and Molenda leave us with a somewhat dystopian view of information trajectory in the internet age. “In today’s Information Age it is immensely difficult, if not practically impossible, to contain the spread of bad ideas within cyberspace. As we speak, the corrupted cone and its attendant “data” are akin to a living organism—a virtual 21st century plague—that continues to spread and mutate all over the World Wide Web, most recently to China. It therefore seems logical—and responsible—on our part that we would ourselves endeavor to continue our efforts to combat this vexing misinformation on the Web as well.”

Later, I will provide a section on what we can all do to help debunk the myths and inaccuracies imbedded in these fabrications.

Now, I provide a synopsis of each article in the Special Edition.


Synopsis of First Article:

Citation:
Subramony, D., Molenda, M., Betrus, A., and Thalheimer, W. (2014). The Mythical Retention Chart and the Corruption of Dale’s Cone of Experience. Educational Technology, Nov/Dec 2014, 54(6), 6-16.

The authors point out that, “Learners—both face-to-face and distant—in classrooms, training centers, or homes are being subjected to lessons designed according to principles that are both unreliable and invalid. In any profession this would be called malpractice.” (p. 6).

The article makes four claims.

Claim 1: The Data in the Retention Chart is Not Credible

First, there is no body of research that supports the data presented in the many forms of the retention chart. That is, there is no scientific data—or other data—that supports the claim that People Remember some percentage of what they learned. Interestingly, where people have relied on research citations from 1943, 1947, 1963, and 1967 as the defining research when they cite the source of their data, the numbers—10%, 20%, 30% and so on—actually appeared as early as 1914 and 1922—when they were presented as information long known. A few years ago, I compiled research on actual percentages of remembering. You can access it here.

Second, the fact that the numbers all are divisible by 5 or 10 makes it obvious to anyone who has done research that these are not numbers derived by actual research. Human variability precludes round numbers. In addition, as pointed out as early at 1978 by Dwyer, there is the question of how the data were derived—what were learners actually asked to do? Note for example that the retention chart data always measures—among other things—how much people remember by reading, hearing, and seeing. How people could read without seeing is an obvious confusion. What are people doing when they only see and don’t read or listen? Also problematic is how you’d create a fair test to compare situations where learners listened or watched something. Are they tested on different tests (one where they see and one where they listen), which seems to allow bias or are they tested on the same test, in which case on group would be at a disadvantage because they aren’t taking a test in the same context in which they learned.

Third, the data portrayed don’t relate to any other research in the scientific literature on learning. As the authors write, “There is within educational psychology a voluminous literature on remembering and learning from various mediated experiences. Nowhere in this literature is there any summary of findings that remotely resembles the fictitious retention chart.” (p. 8)

Finally, as the author’s say, “Making sense of the retention chart is made nearly impossible by the varying presentations of the data, the numbers in the chart being a moving target, altered by the users to fit their individual biases about desirable training methods.” (p. 9).

Claim 2: Dale’s Cone is Misused.

Dale’s Cone of Experience is a visual depiction that portrays more concrete learning experiences at the bottom of the cone and more abstract experiences at the top of the cone. As the authors write, “The cone shape was meant to convey the gradual loss of sensory information” (p. 9) in the learning experiences as one moved from lower to higher levels on the cone.

“The root of all the perversions of the Cone is the assumption that the Cone is meant to be a prescriptive guide. Dale definitely intended the Cone to be descriptive—a classification system, not a road map for lesson planning.” (p. 10)

Claim 3: Combining the Retention Chart Data with Dale’s Cone

“The mythical retention data and the concrete-to-abstract cone evolved separately throughout the 1900’s, as illustrated in [the fourth article] ‘Timeline of the Mythical Retention Chart and Corrupted Dale’s Cone.’ At some point, probably around 1970, some errant soul—or perhaps more than one person—had the regrettable idea of overlaying the dubious retention data on top of Dale’s Cone of Experience.” (p. 11). We call this concoction the corrupted cone.

“What we do know is that over the succeeding years [after the original corruption] the corrupted cone spread widely from one source to another, not in scholarly publications—where someone might have asked hard questions about sources—but in ephemeral materials, such as handouts and slides used in teaching or manuals used in military or corporate training.” (p. 11-12).

“With the growth of the Internet, the World Wide Web, after 1993 this attractive nuisance spread rapidly, even virally. Imagine the retention data as a rapidly mutating virus and Dale’s Cone as a host; then imagine the World Wide Web as a bathhouse. Imagine the variety of mutations and their resistance to antiviral treatment. A Google Search in 2014 revealed 11,000 hits for ‘Dale’s Cone,’ 14,500 for ‘Cone of Learning,’ and 176,000 for ‘Cone of Experience.’ And virtually all of them are corrupted or fallacious representations of the original Dale’s cone. It just might be the most widespread pedagogical myth in the history of Western civilization!” (p. 11).

Claim 4: Murky Provenance

People who present the fallacious retention data and/or the corrupted cone often cite other sources—that might seem authoritative. Dozens of attributions have been made over the years, but several sources appear over and over, including the following:

  • Edgar Dale
  • Wiman & Meierhenry
  • Bruce Nyland
  • Various oil companies (Mobil, Standard Oil, Socony-Vacuum Oil, etc.)
  • NTL Institute
  • William Glasser
  • British Audio-Visual Society
  • Chi, Bassok, Lewis, Reimann, & Glaser (1989).

Unfortunately, none of these sources are real sources. They are false.

Conclusion:

“The retention chart cannot be supported in terms of scientific validity or logical interpretability. The Cone of Experience, created by Edgar Dale in 1946, makes no claim of scientific grounding, and its utility as a prescriptive theory is thoroughly unjustified.” (p. 15)

“No qualified scholar would endorse the use of this mish-mash as a guide to either research or design of learning environments. Nevertheless, [the corrupted cone] obviously has an allure that surpasses logical considerations. Clearly, it says something that many people want to hear. It reduces the complexity of media and method selection to a simple and easy to remember formula. It can thus be used to support a bias toward whatever learning methodology might be in vogue. Users seem to employ it as pseudo-scientific justification for their own preferences about media and methods.” (p. 15)


Synopsis of Second Article:

Citation:
Subramony, D., Molenda, M., Betrus, A., and Thalheimer, W. (2014). Previous Attempts to Debunk the Mythical Retention Chart and Corrupted Dale’s Cone. Educational Technology, Nov/Dec 2014, 54(6), 17-21.

The authors point to earlier attempts to debunk the mythical retention data and the corrupted cone. “Critics have been attempting to debunk the mythical retention chart at least since 1971. The earliest critics, David Curl and Frank Dwyer, were addressing just the retention data.  Beginning around 2002, a new generation of critics has taken on the illegitimate combination of the retention chart and Edgar Dale’s Cone of Experience – the corrupted cone.” (p. 17).

Interestingly, we only found two people who attempted to debunk the retention “data” before 2000. This could be because we failed to find other examples that existed, or it might just be because there weren’t that many examples of people sharing the bad information.

Starting in about 2002, we noticed many sources of refutation. I suspect this has to do with two things. First, it is easier to quickly search human activity in the internet age, giving an advantage in seeking examples. Second, the internet also makes it easier for people to post the erroneous information and share it to a universal audience.

The bottom line is that there have been a handful of people—in addition to the four authors—who have attempted to debunk the bogus information.


Synopsis of Third Article:

Citation:
Subramony, D., Molenda, M., Betrus, A., and Thalheimer, W. (2014). The Good, the Bad, and the Ugly: A Bibliographic Essay on the Corrupted Cone. Educational Technology, Nov/Dec 2014, 54(6), 22-31.

The authors of the article provide a series of brief synopses of the major players who have been cited as sources of the bogus data and corrupted visualizations. The goal here is to give you—the reader—additional information so you can make your own assessment of the credibility of the research sources provided.

Most people—I suspect—will skim through this article with a modest twinge of voyeuristic pleasure. I did.


Synopsis of Fourth Article:

Citation:
Subramony, D., Molenda, M., Betrus, A., and Thalheimer, W. (2014). Timeline of the Mythical Retention Chart and Corrupted Dale’s Cone. Educational Technology, Nov/Dec 2014, 54(6), 31-24.

The authors present a decade-by-decade outline of examples of the reporting of the bogus information—From 1900 to the 2000s. The outline represents great detective work by my co-authors, who have spent years and years searching databases, reading articles, and reaching out to individuals and institutions in search of the genesis and rebirth of the bogus information. I’m in continual awe of their exhaustive efforts!

The timeline includes scholarly work such as the “Journal of Education,” numerous books, academic courses, corporate training, government publications, military guidelines, etc.

The breadth and depth of examples demonstrates clearly that no area of the learning profession has been immune to the disease of poor information.


Synopsis of the Exhibits:

The authors catalog 16 different examples of the visuals that have been used to convey the mythical retention data and/or the corrupted cone. They also present about 25 text examples.

The visual examples are black-and-white canonical versions, and given these limitations, can’t convey the wild variety of examples available now on the internet. Still, they show in their variety just how often people have modified Dale’s Cone to support their own objectives.


My Conclusions, Warnings, and Recommendations

The four articles in the special edition of Educational Technology represent a watershed moment in the history of misinformation in the learning profession. The articles utilize two examples—the mythical retention data (“People remember 10%, 20%, 30%…”) and the numerical corruptions of Dale’s Cone—and demonstrate the following:

  1. There are definitively-bogus data sources floating around the learning profession.
  2. These bogus information sources damage the effectiveness of learning and hurt learners.
  3. Authors of these bogus examples do not do their due diligence in confirming the validity of their research sources. They blithely reproduce sources or augment them before conveying them to others.
  4. Consumers of these bogus information sources do not do their due diligence in being skeptical, in expecting and demanding validated scientific information, in pushing back against those who convey weak information.
  5. Those who stand up publically to debunk such misinformation—though nobly fighting a good fight—do not seem to be winning the war against this misinformation.
  6. More must be done if we are to limit the damage.

Some of you may chaff at my tone here, and if I had more time I might have been able to be more careful in my wording. But still, this stuff matters! Moreover, these articles focus only on two examples of bogus memes in the learning field. There are many more! Learning styles anyone?

Here is what you can do to help:

  1. Be skeptical.
  2. When conveying or consuming research-based information, check the actual source. Does it say what it is purported to say? Is it a scientifically-validated source? Are there corroborating sources?
  3. Gently—perhaps privately—let conveyors of bogus information know that they are conveying bogus information. Show them your sources so they can investigate for themselves.
  4. When you catch someone conveying bogus information, make note that they may be the kind of person who is lazy or corrupt in the information they convey or use in their decision making.
  5. Punish, sanction, or reprimand those in your sphere of influence who convey bogus information. Be fair and don’t be an ass about it.
  6. Make or take opportunities to convey warnings about the bogus information.
  7. Seek out scientifically-validated information and the people and institutions who tend to convey this information.
  8. Document more examples.

To this end, Anthony Betrus—on behalf of the four authors—has established www.coneofexperience.com. The purpose of this website is to provide a place for further exploration of the issues raised in the four articles. It provides the following:

  • Series of timelines
  • Links to other debunking attempts
  • Place for people to share stories about their experience with the bogus data and visuals.

The learning industry also has responsibilities.

  1. Educational institutions must ensure that validated information is more likely to be conveyed to their students, within the bounds of academic freedom…of course.
  2. Educational institutions must teach their students how to be good consumers of “research,” “data,” and information (more generally).
  3. Trade organizations must provide better introductory education for their members; more myth-busting articles, blog posts, videos, etc.; and push a stronger evidence-based-practice agenda.
  4. Researchers have to partner with research translators more often to get research-based information to real-world practitioners.

Links:


In an article by Farhad Manjoo in the New York Times reports on Google's efforts to improve diversity. This is a compendable effort.

I was struck that while Google was utilizing scientists to devise the content of a diversity training program, it didn't seem to be utilizing research on the learning-to-performance process at all. It could be that Manjoo left it out of the article, or it could be that Google is missing the boat. Here's my commentary:

Dear Farhad,

Either this article is missing vital information–or Google, while perhaps using research on unconscious biases, is completely failing to utilize research-based best practices in learning-to-performance design. Ask almost any thought leader in the training-and-development field and they'll tell you that training by itself is extremely unlikely to substantially change behavior on its own, without additional supports.

By the way, the anecdotes cited for the success of Google's 90-minute training program are not persuasive. It's easy to find some anecdotes that support one's claims. Scientists call this "confirmation bias."

Believe it or not, there is a burgeoning science around what successful learning-to-performance solutions look like. This article, unfortunately, encourages the false notion that training programs alone will be successful in producing behavior change.

As of today, the Learning Styles Challenge payout is rising from $1000 to $5000! That is, if any person or group creates a real-world learning intervention that takes learning styles into account–and proves that such an intervention produces better learning results than a non-learning-styles intervention, they’ll be awarded $5,000!

Special thanks to the new set of underwriters, each willing to put $1000 in jeopardy to help get the word out to the field:

Learning Styles Challenge Rules

We’re still using the original rules, as established back in 2006. Read them here.


What is Implied in This Debunking

The basic finding in the research is that learning interventions that take into account learning styles do no better than learning interventions that do not take learning styles into account. This does not mean that people do not have differences in the way they learn. It just means that designing with learning styles in mind is unlikely to produce benefits–and thus the extra costs are not likely to be a good investment.

Interestingly, there are learning differences that do matter! For example, if we really want to get benefits from individual differences, we should consider the knowledge and skill level of our learners.


What Can You Do to Spread the Word

Thanks to multiple efforts by many people over the years to lessen the irrational exuberance of the learning-styles proliferators, fewer and fewer folks in the learning field are falling prey to the learning-styles myth. But the work is not done yet. This issue still needs your help!

Here’s some ideas for how you can help:

  • Spread the word through social media! Blogs, Twitter, LinkedIn, Facebook!
  • Share this information with your work colleagues, fellow students, etc.
  • Gently challenge those who proselytize learning styles.
  • Share the research cited below.


History of the Learning Styles Challenge

It has been exactly eight years since I wrote in a blog post:

I will give $1000 (US dollars) to the first person or group who can prove that taking learning styles into account in designing instruction can produce meaningful learning benefits.

Eight years is a long time. Since that time, over one billion babies have been born, 72 billion metric tons of carbon pollution have been produced, and the U.S. Congress has completely stopped functioning.

However, not once in these past eight years has any person or group collected on the Learning Styles challenge. Not once!


Research on Learning Styles

However, since 2006, more and more people have discovered that learning styles are unlikely to be an effective way to design instruction.

First, there was the stunning research review in the top-tier scientific journal, Psychological Science in the Public Interest:

Pashler, H., McDaniel, M., Rohrer, D., & Bjork, R. (2008). Learning styles: Concepts and evidence. Psychological Science in the Public Interest, 9(3), 105-119.

The authors wrote the following:

We conclude therefore, that at present, there is no adequate evidence base to justify incorporating learning-styles assessments into general educational practice. Thus, limited education resources would better be devoted to adopting other educational practices that have a strong evidence base, of which there are an increasing number. However, given the lack of methodologically sound studies of learning styles, it would be an error to conclude that all possible versions of learning styles have been tested and found wanting; many have simply not been tested at all. (p. 105)

To read more about what they wrote, click here.

Two years later, two of the authors reiterated their findings in a separate–and nicely written–article for the Association for the Study of Medical Education. You can access that article at: http://uweb.cas.usf.edu/~drohrer/pdfs/Rohrer&Pashler2012MedEd.pdf. Here’s the research citation:

Rohrer, D., & Pashler, H. (2012). Learning styles: Where’s the evidence? Medical Education, 46(7), 634-635.

A researcher who had once advocated for learning styles did an about face after he did some additional research:

Cook, D. A. (2012). Revisiting cognitive and learning styles in computer-assisted instruction: Not so useful after all. Academic Medicine, 87(6), 778-784.
Of course, not everyone is willing to give up on learning styles. For example, Furnham (2012) wrote:
The application of, and research into, learning styles and approaches is clearly alive and well. (p. 77).
Furnham, A. (2012). Learning styles and approaches to learning. In K. R. Harris, S. Graham, T. Urdan, S. Graham, J. M. Royer, & M. Zeidner (Eds.), APA handbooks in psychology. APA educational psychology handbook, Vol. 2. Individual differences and cultural and contextual factors (pp. 59-81). doi:10.1037/13274-003

A quick cursory look–today–through the PsycINFO database shows that scientific published articles on learning styles are still being published.


Learning Styles in the Workplace Learning Field

Guy Wallace, performance analyst and instructional architect, has been doing a great job keeping the workplace learning field up on the learning-styles debate. Check out his article in eLearn Magazine and his blog post update.

You’ll note from Guy’s blog post that many prominent thought leaders in the field have been suspicious of learning styles for many years.


The Edgar Dale Myth recently resurfaced in a TED Talk, indicating that TED talks–though doing a great job preparing the speaker to be engaging–don't fact check.

Here is the offending TED Talk, with the erroneous information starting at 5:48.

http://www.youtube.com/watch?v=u8ecQDX1XOw

As chronicled on this blog since 2006, and on a precursor website since 2002 (12 years ago), the Edgar Dale Myth is pernicious, dangerous, and seemingly immortal. See the following link for the original post:

http://is.gd/EdgarDaleMyth

Special thanks to JC Kinnamon, PhD for pointing out the offending video to me. JC has been a long-time compiler of the Edgar Dale Myth, and I thank him for his continued efforts!

Crazy Thought

Perhaps there is a silver lining in the continued resurfacing of these myths. For years, I've seen these myths as completely detrimental to our field–something to squash with crusader-like zealotry.

But the speaker in the TED video got me thinking. Perhaps these myths have social value. Perhaps when a myth surfaces, we are receiving an important signal that the conveyor of the myth is a lightweight–that it is very likely that he or she (or they) really don't understand learning at a deep level.

One of the things I hope everybody in the learning field understands is that, first, there is good research and there is bad research; and second, that people who cite research fall into two categories. Some people seek the truth in the research and report what they find. Other people seek research to prop up their previously-held beliefs, to "demonstrate" the benefits of their products or services, or to cast themselves in an aura of credibility.

Beware of People Citing Research

Yes, it's complicated! And everybody suffers somewhat from unintentional confirmatory bias, but caveat emptor, we as professionals have to be careful in assessing research claims. Science is built on skepticism. Professional practice should utilize a healthy dose of skepticism as well.

The speaker at the TED talk showed that he couldn't be trusted to know learning at a deep level by his use of this phony Edgar Dale "research." And then he double-confirmed it by asking his audience to play word bingo. He gave everybody a bingo card with words on it. Then he had people keep track of the words he was saying. When someone got all the words in a row, column, or diagonal he had them stand up and say BINGO, with applause from the audience. Anybody who knows learning knows that his word-bingo game distracted the audience from the main points of his message, hurting learning.

The use of the Edgar Dale myth by the speaker was an accurate portrayal of his lack of deep knowledge. He may have had some valuable things to say otherwise, but how could we be sure–indications were not good.

Is there a silver lining in the re-occurance of these myths? I've tried to convince myself in writing this that there might be some benefit, but the benefit comes only to those who know that the myths are myths!!! And, for the benifits to accrue, those of us who are out there trying to squash the myths must continue to proselytize and educate. Indeed, for our field to maximize its positive influence, each and every one of us must be hungry hunters of good research, skeptical assessors, and eager communicators.

So, send this blog post to those who are open to continuous improvement. SMILE


Here is the comment I sent to the NY Times in response to their focus on a supposed research study that purported to show that gifted kids are being underserved.

I'm a little over the top in my comments, but still I think this is worth printing because it demonstrates the need for good research savvy and it shows that even the most respected news organizations can make really poor research-assessment mistakes.

Egads!! Why is the New York Times giving so much "above-the-fold" visibility to a poorly-conceived research study funded by a conservative think tank with obvious biases?

Why isn't at least one of your contributors a research-savvy person who could comment on the soundness of the research? Instead, your contributors assume the research is sound.

Did you notice that the references in the original research report were not from top-tier refereed scientific journals?

In the original article from the Thomas Fordham Institute (a conservative-funded enterprise), the authors try to wash away criticisms about regression-to-the-mean and test-variability, but this bone against the obvious–and most damaging, and most valid–criticisms is not good enough.

If you took the top 10% of players in the baseball draft, the football draft, any company's onboarding class, any randomly selected group of maple trees, a large percentage of the top performers would not be top performers a year or two later. Damn, ask any baseball scout whether picking out the best prospects is a sure thing. It's not!

And, in the cases I mentioned above, the measures are more objective than an educational test, which has much higher variability–which would make more top performers leak out of the top ranks.

NY Times–you should be embarrassed to have published these responses to this non-study. Seriously, don't you have any research-savvy people left on your staff?

We have scientific journals because the research is vetted by experts.

Check out this article which claims:

"Science of mind is one of the most important intellectual developments in the last half century. It should not be obscured by neurobabble."

This might be a follow-up post to an earlier one I wrote that showed how easily we are fooled by scientific claims.


Transfer of Training Estimates

Have you heard or seen any of the following statements? And do you believe them?

“Only 10% of training transfers to the job.”

“Only 10% of the investment in training
actually transfers to the job.”

“Although $100 billion is spent on
training each year, only 10%
of these expenditures
result in transfer to the job.”

Similar citations have been used in both the research and practitioner communities. But is any of this information accurate? Robert Fitzpatrick’s cautionary tale about how an innocent rhetorical question became twisted into established fact should make all of us skeptical enough to question the veracity of the claims that we encounter.

The following article is reprinted with permission from the TIP Newsletter of the Society for Industrial and Organizational Psychology (SIOP), a well-respected organization of Industrial/Organizational Psychologists. To learn more about SIOP, visit their website. To learn about the TIP Newsletter, a non-refereed publication of SIOP, visit http://my.siop.org/tipdefault.


The Strange Case of the Transfer of Training Estimate

Robert Fitzpatrick
Cranberry Township, Pennsylvania

Some time ago, a learning systems product development manager named David L. Georgenson set about to write an article on transfer of training, with emphasis on ways in which it might best be nurtured in organizations. To introduce his discussion, Georgenson hit upon the idea of asking a rhetorical question, thus: “How many times have you heard training directors say: ‘I…would estimate that only 10% of content which is presented in the classroom is reflected in behavioral change on the job’” (Georgenson, 1982, p.75). Georgenson had no need to, and did not, cite any evidence or authority for the 10% estimate; it is clear that he had used a rhetorical device to catch the reader’s attention. The estimate may or may not be accurate; it seems plausible but not compellingly so.

Georgenson’s article contains nothing about the dollar cost of training. There is no reason that Georgenson should have dealt with cost, and he did not.

In time, other authors wanted to write on transfer and to find some introductory way to convince the reader that transfer is indeed a problem worth writing about. And so were spawned a number of articles and books which used the estimate of Georgenson’s fictive training directors. Here are some examples in which Georgenson (1982) was specifically cited as the source:

“It is also estimated that only 10% of the dollars spent on training results in actual behavioral change back on trainees’ jobs” (Wexley & Baldwin, 1986, p. 503).

“It is estimated that while American industries annually spend up to $100 billion on training and development, not more than 10% of these expenditures actually result in transfer to the job” (Baldwin & Ford, 1988, p. 63).

“Less than 10% of [estimated expenditures on staff development] may produce behavioral changes on the job” (Alavi, 1994, p. 160).

“Georgenson (1981) [sic] estimated that not more than 10% of the $100 billion spent by industry actually made a difference to what happens in the workplace!” (Dickson & Bamford, 1995, p. 91)

“…given the finding that only 10% of training expenditures have been shown to result in behavioral changes back on the job” (Facteau, Dobbins, Russell, Ladd, & Kudisch, 1995, p. 2).

And there is more. Some writers on transfer did not cite Georgenson but did cite others who cited Georgenson. For instance:

“A recent comprehensive survey of research and literature by Timothy Baldwin and Kevin Ford found the following:…It is estimated that while American industries annually spend up to $100 billion on training and development, not more than 10% of these expenditures actually result in transfer to the job…(1988, p. 63).” (Broad & Newstrom, 1992, p. 7)

“Timothy Baldwin and Kevin Ford (1988, p. 63) report: ‘Not more than 10% of these expenditures [on training] actually result in transfer to the job.’” (Robinson & Robinson, 1995, p. 3) See also Fitzpatrick (1996).

In most of these examples, the 10% figure is accurately identified as an estimate, though words such as “finding” and “report” do appear. But almost all refer to $100 billion, though Georgenson’s imaginary training directors said nothing about expenditures. If they had, one supposes they would have made some adjustment for inflation over the years.

All the writings cited here so far come from 1996 or earlier. I found most of them through the Social Science Citation Index. Soon, the search process became burdensome and the returns seemed to be diminishing. I put the information aside, with the thought that, like the black plague of long ago, the epidemic of transfer estimates had run its course.

But recently I caught up with the April 2001 issue of the Journal of Applied Psychology. There, in the introductory paragraph of an otherwise enlightening article, it says: “U.S. businesses spend upwards of $100 billion annually on formal and informal training activities (Georgenson, 1982). However, it is estimated that only 10% of these training expenditures result in transfer of training to the job (Georgenson, 1982).” (Smith-Jentsch, Salas, & Brannick, 2001, p.279)

So the plague is back. Or perhaps it never went away. Some will say it doesn’t matter. It’s only introductory fluff, not centrally germane to the main thrust of the topic which it introduces.

But others may argue that it does matter. If we can’t trust the introductory citations, how can we then accept the more weighty citations and ideas which follow? And sometimes the introductory matter is important in itself; if Georgenson had said that only 90% of what is taught is transferred to the job, isn’t it less likely that we would have read his article (or funded his study of transfer) in the first place?

References

Alavi, M. (1994). Computer-mediated collaborative learning: An empirical evaluation. MIS Quarterly, 18, 159–174.

Baldwin, T. T., & Ford, J. K. (1988). Transfer of training: A review and directions for future research. Personnel Psychology, 41, 63–105.

Broad, M. L., & Newstrom, J. W. (1992). Transfer of training: Action-packed strategies to ensure high payoff from training investments. Reading, MA: Addison-Wesley.

Dickson, D., & Bamford, D. (1995). Improving the interpersonal skills of social work students: The problem of transfer of training and what to do about it. British Journal of Social Work, 25, 85–105.

Facteau, J. D., Dobbins, G. H., Russell, J. E. A., Ladd, R. T., & Kudisch, J. D. (1995). The influence of general perceptions of the training environment on pretraining motivation and perceived training transfer. Journal of Management, 21, 1–25.

Fitzpatrick, R. (1996). [Review of the book Performance consulting: Moving beyond training]. Personnel Psychology, 49, 188-191.

Georgenson, D. L. (1982). The problem of transfer calls for partnership. Training and Development Journal, 36 (10), 75-78.

Robinson, D. G., & Robinson, J. C. (1995). Performance consulting: Moving beyond training. San Francisco: Berrett-Koehler.

Smith-Jentsch, K. A., Salas, E., & Brannick, M. T. (2001). To transfer or not to transfer? Investigating the combined effects of trainee characteristics, team leader support, and team climate. Journal of Applied Psychology, 86, 279-292.

Wexley, K. N., & Baldwin, T. T. (1986). Posttraining strategies for facilitating positive transfer: An empirical exploration. Academy of Management Journal, 29, 503-520.

End of article by Robert Fitzpatrick


To see the original article online, go to: http://www.siop.org/tip/backissues/TipOct01/pdf%20tip/392_018to019.pdf


…Will Thalheimer continues the discussion below…

Implications for the Learning-and-Performance World.

Obviously, we should ignore the 10% number. More broadly, we need to be sure we’re not basing our instructional-design and performance-improvement decisions on faulty information. There’s lots of it out there. We need to find information we can trust and we need to develop ways to check the validity of the claims that we encounter.


The Association of Psychological Science commissioned a review of the evidence for the benefits of using learning styles, and the report is clear.

We conclude therefore, that at present, there is no adequate evidence base to justify incorporating learning-styles assessments into general educational practice. Thus, limited education resources would better be devoted to adopting other educational practices that have a strong evidence base, of which there are an increasing number. However, given the lack of methodologically sound studies of learning styles, it would be an error to conclude that all possible versions of learning styles have been tested and found wanting; many have simply not been tested at all. (p. 105)

Research Citation:

Pashler, H., McDaniel, M., Rohrer, D., & Bjork, R.
(2008).
Learning styles: Concepts and evidence.
Psychological Science in the Public Interest, 9, 105-119.

You can access the article by clicking here.

You can access Richard Mayer’s nice intro to the article—which stresses the benefits of research—by clicking here.

My $1,000 Learning Styles Challenge

Three and one half years ago I offered $1,000 to any person or group who could demonstrate the benefits of learning styles in a real-world practical training program. No one has collected the money yet.

Here was the challenge:

Can an e-learning program that utilizes learning-style information
outperform an e-learning program that doesn’t utilize such information
by 10% or more on a realistic test of learning, even it is allowed to
cost up to twice as much to build?

You can access my original Learning Styles Challenge by clicking here.

You can access my three-year update on the challenge by clicking here.

Final Nail in the Coffin of Learning Styles?

Is this excellent research review by some of the most highly-respected researchers in the learning-research field a final nail in the coffin of learning styles?

Well, as a researcher I must always maintain openness to new information. Perhaps someday more research will demonstrate some specific benefits to learning styles. As the authors of the review say themselves:

Although we have argued that the extant data do not provide support for the learning-styles hypothesis, it should be emphasized that we do not claim that the same kind of instruction is most useful in all contexts and with all learners. An obvious point is that the optimal instructional method is likely to vary across disciplines. For instance, the optimal curriculum for a writing course probably includes a heavy verbal emphasis, whereas the most efficient and effective method of teaching geometry obviously requires visual–spatial materials. Of course, identifying the optimal approach for each discipline is an empirical question, and we espouse research using strong research methods to identify the optimal approach for each kind of subject matter.

Furthermore, it is undoubtedly the case that a particular student will sometimes benefit from having a particular kind of course content presented in one way versus another. One suspects that educators’ attraction to the idea of learning styles partly reflects their (correctly) noticing how often one student may achieve enlightenment from an approach that seems useless for another student. There is, however, a great gap from such heterogeneous responses to instructional manipulations—whose reality we do not dispute—to the notion that presently available taxonomies of student types offer any valid help in deciding what kind of instruction to offer each individual. Perhaps future research may demonstrate such linkages, but at present, we find no evidence for it. (p. 116)

As a consultant in the workplace learning-and-performance field, I will likely do my clients harm if I advised for the use of a learning-style learning design. I will continue to advise clients against designing their learning based on learning styles. At the same time, I will encourage them to be watchful for specific learning needs of individual learners. For example, when a learner is confused, he or she probably needs feedback and guidance.

I recommend that you read the article and Mayer’s introduction. Both provide wisdom about how to think about research and how to avoid being fooled.

Article Note: The date in the article and on the database PsycINFO says the article is from 2008. However, the
copyright is from 2009 and the article includes citations from 2009 and
the article appears as the “current article” on the APS (Association for
Psychological Science) website, and news reports just started surfacing in December 2009 and January 2010. The evidence suggests the article just recently came out.