The Danger

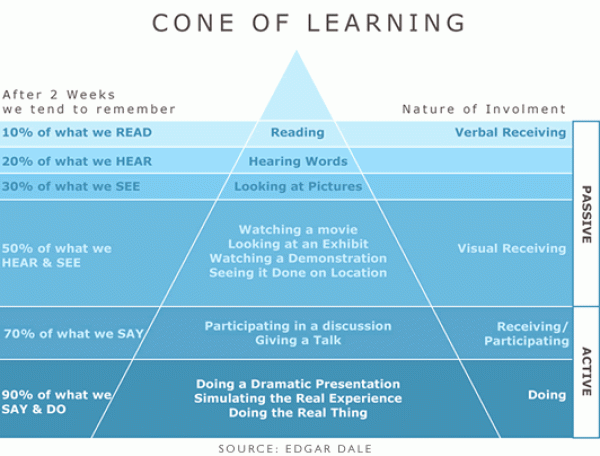
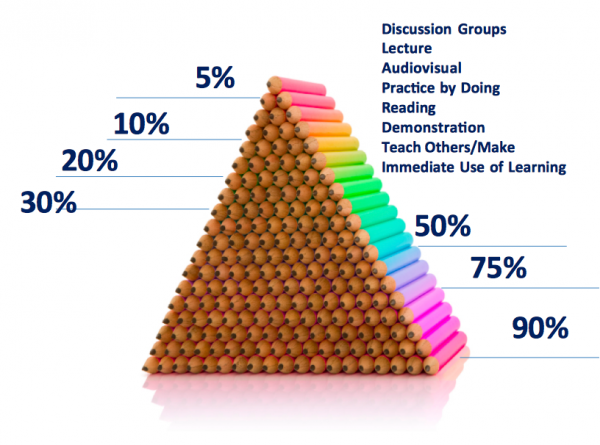
Have you ever seen the following “research” presented to demonstrate some truth about human learning?

Unfortunately, all of the above diagrams are evangelizing misleading information. Worse, these fabrications have been rampant over the last two or three decades—and seem to have accelerated during the age of the internet. Indeed, a Google image search for “Dale’s Cone” produces about 80% misleading information, as you can see below from a recent search.

Search 2015:


Search 2017:


This proliferation is a truly dangerous and heinous result of incompetence, deceit, confirmatory bias, greed, and other nefarious human tendencies.

It is also hurting learners throughout the world—and it must be stopped. Each of us has a responsibility in this regard.


New Research

Fortunately, a group of tireless researchers—who I’ve had the honor of collaborating with—has put a wooden stake through the dark heart of this demon. In the most recent addition of the scientific journal Educational Technology, Deepak Subramony, Michael Molenda, Anthony Betrus, and I (my contribution was small) produced four articles on the dangers of this misinformation and the genesis of it. After working separately over the years to debunk this bit of mythology, the four of us have come together in a joint effort to rally the troops—people like you, dedicated professionals who want to create the best outcomes for your learners.

Here are the citations for the four articles. Later, I will have a synopsis of each article.

Subramony, D., Molenda, M., Betrus, A., and Thalheimer, W. (2014). The Mythical Retention Chart and the Corruption of Dale’s Cone of Experience. Educational Technology, Nov/Dec 2014, 54(6), 6-16.

Subramony, D., Molenda, M., Betrus, A., and Thalheimer, W. (2014). Previous Attempts to Debunk the Mythical Retention Chart and Corrupted Dale’s Cone. Educational Technology, Nov/Dec 2014, 54(6), 17-21.

Subramony, D., Molenda, M., Betrus, A., and Thalheimer, W. (2014). The Good, the Bad, and the Ugly: A Bibliographic Essay on the Corrupted Cone. Educational Technology, Nov/Dec 2014, 54(6), 22-31.

Subramony, D., Molenda, M., Betrus, A., and Thalheimer, W. (2014). Timeline of the Mythical Retention Chart and Corrupted Dale’s Cone. Educational Technology, Nov/Dec 2014, 54(6), 31-24.

Many thanks to Lawrence Lipsitz, the editor of Educational Technology, for his support, encouragement, and efforts in making this possible!

To get a copy of the “Special Issue” or to subscribe to Educational Technology, go to this website. (Note, 2017: I don’t think the journal is being published anymore.)


The Background

There are two separate memes we are debunking, what we’ve labeled (1) the mythical retention chart and (2) the corruption of Dale’s Cone of Experience. As you will see—or might have noticed in the images I previously shared—the two have often be comingled.

Here is an example of the mythical retention chart:


Oftentimes though, this is presented in text:

“People Remember:

  • 10 percent of what they read;
  • 20 percent of what they hear;
  • 30 percent of what they see;
  • 50 percent of what they see and hear;
  • 70 percent of what they say; and
  • 90 percent of what they do and say

Note that the numbers proffered are not always the same, nor are the factors alleged to spur learning. So, for example, you can see that on the graphic, people are said to remember 30 percent of what they hear, but in the text, the percentage is 20 percent. In the graphic, people remember 80 percent when they are collaborating, but in the text they remember 70% of what they SAY. I’ve looked at hundreds of examples, and the variety is staggering.

Most importantly, the numbers do NOT provide good guidance for learning design, as I will detail later.

Here is a photocopied image of the original Dale’s Cone:

Edgar Dale (1900-1985) was an American educator who is best known for developing “Dale’s Cone of Experience” (the cone above) and for his work on how to incorporate audio-visual materials into the classroom learning experience. The image above was photocopied directly from his book, Audio-visual methods in teaching (from the 1969 edition).


You’ll note that Dale included no numbers in his cone. He also warned his readers not to take the cone too literally.

Unfortunately, someone somewhere decided to add the misleading numbers. Here are two more examples:


I include these two examples to make two points. First, note how one person clearly stole from the other one. Second, note how sloppy these fabricators are. They include a Confucius quote that directly contradicts what the numbers say. On the left side of the visuals, Confucius is purported to say that hearing is better than seeing, while the numbers on the right of the visuals say that seeing is better than hearing. And, by the way, Confucius did not actually say what he is being alleged to have said! What seems clear from looking at these and other examples is that people don’t do their due diligence—their ends seems to justify their means—and they are damn sloppy, suggesting that they don’t think their audiences will examine their arguments closely.

By the way, these deceptions are not restricted to the English-speaking world:


Intro to the Special Issue of Educational Technology

As Deepak Subramony and Michael Molenda say in the introduction to the Special Issue of Educational Technology, the four articles presented seek to provide a “comprehensive and complete analysis of the issues surrounding these tortured constructs.” They also provide “extensive supporting material necessary to present a comprehensive refutation of the aforementioned attempts to corrupt Dale’s original model.”

In the concluding notes to the introduction, Subramony and Molenda leave us with a somewhat dystopian view of information trajectory in the internet age. “In today’s Information Age it is immensely difficult, if not practically impossible, to contain the spread of bad ideas within cyberspace. As we speak, the corrupted cone and its attendant “data” are akin to a living organism—a virtual 21st century plague—that continues to spread and mutate all over the World Wide Web, most recently to China. It therefore seems logical—and responsible—on our part that we would ourselves endeavor to continue our efforts to combat this vexing misinformation on the Web as well.”

Later, I will provide a section on what we can all do to help debunk the myths and inaccuracies imbedded in these fabrications.

Now, I provide a synopsis of each article in the Special Edition.


Synopsis of First Article:

Citation:
Subramony, D., Molenda, M., Betrus, A., and Thalheimer, W. (2014). The Mythical Retention Chart and the Corruption of Dale’s Cone of Experience. Educational Technology, Nov/Dec 2014, 54(6), 6-16.

The authors point out that, “Learners—both face-to-face and distant—in classrooms, training centers, or homes are being subjected to lessons designed according to principles that are both unreliable and invalid. In any profession this would be called malpractice.” (p. 6).

The article makes four claims.

Claim 1: The Data in the Retention Chart is Not Credible

First, there is no body of research that supports the data presented in the many forms of the retention chart. That is, there is no scientific data—or other data—that supports the claim that People Remember some percentage of what they learned. Interestingly, where people have relied on research citations from 1943, 1947, 1963, and 1967 as the defining research when they cite the source of their data, the numbers—10%, 20%, 30% and so on—actually appeared as early as 1914 and 1922—when they were presented as information long known. A few years ago, I compiled research on actual percentages of remembering. You can access it here.

Second, the fact that the numbers all are divisible by 5 or 10 makes it obvious to anyone who has done research that these are not numbers derived by actual research. Human variability precludes round numbers. In addition, as pointed out as early at 1978 by Dwyer, there is the question of how the data were derived—what were learners actually asked to do? Note for example that the retention chart data always measures—among other things—how much people remember by reading, hearing, and seeing. How people could read without seeing is an obvious confusion. What are people doing when they only see and don’t read or listen? Also problematic is how you’d create a fair test to compare situations where learners listened or watched something. Are they tested on different tests (one where they see and one where they listen), which seems to allow bias or are they tested on the same test, in which case on group would be at a disadvantage because they aren’t taking a test in the same context in which they learned.

Third, the data portrayed don’t relate to any other research in the scientific literature on learning. As the authors write, “There is within educational psychology a voluminous literature on remembering and learning from various mediated experiences. Nowhere in this literature is there any summary of findings that remotely resembles the fictitious retention chart.” (p. 8)

Finally, as the author’s say, “Making sense of the retention chart is made nearly impossible by the varying presentations of the data, the numbers in the chart being a moving target, altered by the users to fit their individual biases about desirable training methods.” (p. 9).

Claim 2: Dale’s Cone is Misused.

Dale’s Cone of Experience is a visual depiction that portrays more concrete learning experiences at the bottom of the cone and more abstract experiences at the top of the cone. As the authors write, “The cone shape was meant to convey the gradual loss of sensory information” (p. 9) in the learning experiences as one moved from lower to higher levels on the cone.

“The root of all the perversions of the Cone is the assumption that the Cone is meant to be a prescriptive guide. Dale definitely intended the Cone to be descriptive—a classification system, not a road map for lesson planning.” (p. 10)

Claim 3: Combining the Retention Chart Data with Dale’s Cone

“The mythical retention data and the concrete-to-abstract cone evolved separately throughout the 1900’s, as illustrated in [the fourth article] ‘Timeline of the Mythical Retention Chart and Corrupted Dale’s Cone.’ At some point, probably around 1970, some errant soul—or perhaps more than one person—had the regrettable idea of overlaying the dubious retention data on top of Dale’s Cone of Experience.” (p. 11). We call this concoction the corrupted cone.

“What we do know is that over the succeeding years [after the original corruption] the corrupted cone spread widely from one source to another, not in scholarly publications—where someone might have asked hard questions about sources—but in ephemeral materials, such as handouts and slides used in teaching or manuals used in military or corporate training.” (p. 11-12).

“With the growth of the Internet, the World Wide Web, after 1993 this attractive nuisance spread rapidly, even virally. Imagine the retention data as a rapidly mutating virus and Dale’s Cone as a host; then imagine the World Wide Web as a bathhouse. Imagine the variety of mutations and their resistance to antiviral treatment. A Google Search in 2014 revealed 11,000 hits for ‘Dale’s Cone,’ 14,500 for ‘Cone of Learning,’ and 176,000 for ‘Cone of Experience.’ And virtually all of them are corrupted or fallacious representations of the original Dale’s cone. It just might be the most widespread pedagogical myth in the history of Western civilization!” (p. 11).

Claim 4: Murky Provenance

People who present the fallacious retention data and/or the corrupted cone often cite other sources—that might seem authoritative. Dozens of attributions have been made over the years, but several sources appear over and over, including the following:

  • Edgar Dale
  • Wiman & Meierhenry
  • Bruce Nyland
  • Various oil companies (Mobil, Standard Oil, Socony-Vacuum Oil, etc.)
  • NTL Institute
  • William Glasser
  • British Audio-Visual Society
  • Chi, Bassok, Lewis, Reimann, & Glaser (1989).

Unfortunately, none of these sources are real sources. They are false.

Conclusion:

“The retention chart cannot be supported in terms of scientific validity or logical interpretability. The Cone of Experience, created by Edgar Dale in 1946, makes no claim of scientific grounding, and its utility as a prescriptive theory is thoroughly unjustified.” (p. 15)

“No qualified scholar would endorse the use of this mish-mash as a guide to either research or design of learning environments. Nevertheless, [the corrupted cone] obviously has an allure that surpasses logical considerations. Clearly, it says something that many people want to hear. It reduces the complexity of media and method selection to a simple and easy to remember formula. It can thus be used to support a bias toward whatever learning methodology might be in vogue. Users seem to employ it as pseudo-scientific justification for their own preferences about media and methods.” (p. 15)


Synopsis of Second Article:

Citation:
Subramony, D., Molenda, M., Betrus, A., and Thalheimer, W. (2014). Previous Attempts to Debunk the Mythical Retention Chart and Corrupted Dale’s Cone. Educational Technology, Nov/Dec 2014, 54(6), 17-21.

The authors point to earlier attempts to debunk the mythical retention data and the corrupted cone. “Critics have been attempting to debunk the mythical retention chart at least since 1971. The earliest critics, David Curl and Frank Dwyer, were addressing just the retention data.  Beginning around 2002, a new generation of critics has taken on the illegitimate combination of the retention chart and Edgar Dale’s Cone of Experience – the corrupted cone.” (p. 17).

Interestingly, we only found two people who attempted to debunk the retention “data” before 2000. This could be because we failed to find other examples that existed, or it might just be because there weren’t that many examples of people sharing the bad information.

Starting in about 2002, we noticed many sources of refutation. I suspect this has to do with two things. First, it is easier to quickly search human activity in the internet age, giving an advantage in seeking examples. Second, the internet also makes it easier for people to post the erroneous information and share it to a universal audience.

The bottom line is that there have been a handful of people—in addition to the four authors—who have attempted to debunk the bogus information.


Synopsis of Third Article:

Citation:
Subramony, D., Molenda, M., Betrus, A., and Thalheimer, W. (2014). The Good, the Bad, and the Ugly: A Bibliographic Essay on the Corrupted Cone. Educational Technology, Nov/Dec 2014, 54(6), 22-31.

The authors of the article provide a series of brief synopses of the major players who have been cited as sources of the bogus data and corrupted visualizations. The goal here is to give you—the reader—additional information so you can make your own assessment of the credibility of the research sources provided.

Most people—I suspect—will skim through this article with a modest twinge of voyeuristic pleasure. I did.


Synopsis of Fourth Article:

Citation:
Subramony, D., Molenda, M., Betrus, A., and Thalheimer, W. (2014). Timeline of the Mythical Retention Chart and Corrupted Dale’s Cone. Educational Technology, Nov/Dec 2014, 54(6), 31-24.

The authors present a decade-by-decade outline of examples of the reporting of the bogus information—From 1900 to the 2000s. The outline represents great detective work by my co-authors, who have spent years and years searching databases, reading articles, and reaching out to individuals and institutions in search of the genesis and rebirth of the bogus information. I’m in continual awe of their exhaustive efforts!

The timeline includes scholarly work such as the “Journal of Education,” numerous books, academic courses, corporate training, government publications, military guidelines, etc.

The breadth and depth of examples demonstrates clearly that no area of the learning profession has been immune to the disease of poor information.


Synopsis of the Exhibits:

The authors catalog 16 different examples of the visuals that have been used to convey the mythical retention data and/or the corrupted cone. They also present about 25 text examples.

The visual examples are black-and-white canonical versions, and given these limitations, can’t convey the wild variety of examples available now on the internet. Still, they show in their variety just how often people have modified Dale’s Cone to support their own objectives.


My Conclusions, Warnings, and Recommendations

The four articles in the special edition of Educational Technology represent a watershed moment in the history of misinformation in the learning profession. The articles utilize two examples—the mythical retention data (“People remember 10%, 20%, 30%…”) and the numerical corruptions of Dale’s Cone—and demonstrate the following:

  1. There are definitively-bogus data sources floating around the learning profession.
  2. These bogus information sources damage the effectiveness of learning and hurt learners.
  3. Authors of these bogus examples do not do their due diligence in confirming the validity of their research sources. They blithely reproduce sources or augment them before conveying them to others.
  4. Consumers of these bogus information sources do not do their due diligence in being skeptical, in expecting and demanding validated scientific information, in pushing back against those who convey weak information.
  5. Those who stand up publically to debunk such misinformation—though nobly fighting a good fight—do not seem to be winning the war against this misinformation.
  6. More must be done if we are to limit the damage.

Some of you may chaff at my tone here, and if I had more time I might have been able to be more careful in my wording. But still, this stuff matters! Moreover, these articles focus only on two examples of bogus memes in the learning field. There are many more! Learning styles anyone?

Here is what you can do to help:

  1. Be skeptical.
  2. When conveying or consuming research-based information, check the actual source. Does it say what it is purported to say? Is it a scientifically-validated source? Are there corroborating sources?
  3. Gently—perhaps privately—let conveyors of bogus information know that they are conveying bogus information. Show them your sources so they can investigate for themselves.
  4. When you catch someone conveying bogus information, make note that they may be the kind of person who is lazy or corrupt in the information they convey or use in their decision making.
  5. Punish, sanction, or reprimand those in your sphere of influence who convey bogus information. Be fair and don’t be an ass about it.
  6. Make or take opportunities to convey warnings about the bogus information.
  7. Seek out scientifically-validated information and the people and institutions who tend to convey this information.
  8. Document more examples.

To this end, Anthony Betrus—on behalf of the four authors—has established www.coneofexperience.com. The purpose of this website is to provide a place for further exploration of the issues raised in the four articles. It provides the following:

  • Series of timelines
  • Links to other debunking attempts
  • Place for people to share stories about their experience with the bogus data and visuals.

The learning industry also has responsibilities.

  1. Educational institutions must ensure that validated information is more likely to be conveyed to their students, within the bounds of academic freedom…of course.
  2. Educational institutions must teach their students how to be good consumers of “research,” “data,” and information (more generally).
  3. Trade organizations must provide better introductory education for their members; more myth-busting articles, blog posts, videos, etc.; and push a stronger evidence-based-practice agenda.
  4. Researchers have to partner with research translators more often to get research-based information to real-world practitioners.

Links:


This article was originally published in Will’s Insight News, my monthly newsletter.

It has been updated and improved to include new information.

Click here if you want to sign up for my newsletter…

Radically Improved Action Planning
Using Cognitive Triggers to Support On-the-Job Performance

Most of us who have been trainers have tried one or more methods of action planning–hoping to get our learners to apply what they’ve learned back on the job. The most common form of action planning goes something like this (at the end of a training program):

“Okay, take a look at this action-planning handout. Think of 3 things from the course you’d like to take away and apply back on the job. This is critically important. If you feel you’ve learned something you’d like to use, you won’t get the results you want if you forget what your goals are. On the handout, you’ll see space to write down your 3 action-planning goals. I’m going to give you 20 minutes to do this because it’s so important!”

Unfortunately, that method is likely to get less than half the follow-through that another–research based–method may get you!

When we as trainers do action planning, we are recognizing that learning is not enough. We want to make sure that all of our passionate, exhaustive efforts at training are not wasted. If we’re honest with ourselves, we know that if our learners forget everything they’ve learned, then we really haven’t been effective. This goes for e-learning as well. There’s a lot of effort that goes into creating an e-learning course–and, if we can maximize the benefits through effective action planning, then we ought to do it.


Before sharing with you my radically improved action-planning method, it’s critical that I motivate it. Look at the above diagram. It shows that the human mind is subject to both conscious and sub-conscious messages. It also shows that the sub-conscious channel is using a broader bandwidth–and when humans process messages consciously, they often filter the messages in ways that limit the effectiveness of those messages.

One of the most important findings from psychological research in the past 10 years–I hate to call it “brain science” because that’s an inaccurate tease–is that much of what controls human thinking comes from or is influenced by sub-conscious primes. Speed limit signs (conscious messages to slow down) are not as effective as narrowing streets, planting trees near streets, and other sub-conscious influencers. Committing to a diet may not be as effective as using smaller dishes, removing snacks from eyesight, and shopping at farmer’s markets instead of in the processed-food isles of grocery stores.

We workplace professionals tend to use the conscious communication channel almost exclusively–we think it’s our job to compile content, make the best arguments for it’s usefulness, and share information so that our learners acknowledge its value and plan to use it. But, if a large part of human cognition is sub-conscious, shouldn’t we use that too? Don’t we have a professional responsibility to be as effective as we can?

My action-planning method does just that. It sets triggers that later create spontaneous sub-conscious prompts to action. I’m calling this “Triggered Action Planning”–a reminder that we are TAP-ping into our learners’ sub-conscious processing to help them remember what they’ve learned. SMILE.

The basic concept is this: We want learners, when they are back on the job, to be reminded of what they’ve learned. We should do this by aligning context–one of the Decisive Dozen research-based learning factors–in our training designs. We can do this by using more hands-on exercises, more real work, more simulations–but we can extend this to action planning as well.

The key is to set SITUATION-ACTION triggers. We want contextual situations to trigger certain actions. So for example, if we teach supervisors to bring their direct reports into decision-making, we want them to think about this when they are having team meetings, when they are discussing a decision with one of their direct reports, etc. The SITUATION could be a team meeting. The ACTION could be delegating a decision, asking for input, etc., as appropriate.

In action planning, it’s even simpler. Instead of just asking our learners what their goals are for implementing what they’ve learned, we also ask them to select situations when they will begin to carry out those goals. So for example:

  • GOAL: I will work with my team to identify a change initiative.
  • SITUATION-ACTION: At our first staff meeting in October, I will work with my team to identify a change initiative.

Remarkably, this kind of intervention–what researchers call “implementation intentions”–has been found to create incredibly significant effects, often doubling compliance of actual performance!!!!!!!!!!!!!

I think this research finding is so important to workplace learning that I’ve devoted a whole section of my unpublished tome to considering how to use it. Instead of using the term “implementation intentions”–it’s such a mouthful–I just call this trigger-setting.

The bottom line here is that we may be able to double the likelihood that our learners actually apply what they’ve learned simply by having our learners link situations and actions in their action planning.

New Job Aid for Triggered Action Planning

You can easily create your own triggered-action planning worksheets or e-learning interactions, but I’ve got one ready to go that you can use as is–FREE OF CHARGE BECAUSE I LOVE TO SHARE–or you can just use it as a starting point for your own triggered-action-planning exercises.


Click here to download the triggered-action-planning job aid (as a PDF)

Click here for a Word version (so you can modify)


Research:

Gollwitzer, P. M., & Sheeran, P. (2006). Implementation intentions and goal achievement: A meta-analysis of effects and processes. Advances in Experimental Social Psychology, 38, 69-119.

Bjork, R. A., & Richardson-Klavehn, A. (1989). On the puzzling relationship between environmental context and human memory. In C. Izawa (Ed.) Current Issues in Cognitive Processes: The Tulane Floweree Symposium on Cognition (pp. 313-344). Hillsdale, NJ: Erlbaum.

Roediger, H. L., III, & Guynn, M. J. (1996). Retrieval processes. In E. L. Bjork & R. A. Bjork (Eds.), Memory (pp. 197-236). San Diego, CA: Academic Press.

Smith, S. M., & Vela, E. (2001). Environmental context-dependent memory: A review and meta-analysis. Psychonomic Bulletin & Review, 8, 203-220.

Thalheimer, W. (2013). The decisive dozen: Research review abridged. Available at the Work-Learning Research catalog.

About two years ago, four enterprising learning researchers reviewed the research on training and development and published their findings in a top-tier refereed scientific journal. They did a really nice job!

Unfortunately, a vast majority of professionals in the workplace learning-and-performance field have never read the research review, nor have they even heard about it.

As a guy whose consulting practice is premised on the idea that good learning research can be translated into practical wisdom for instructional designers, trainers, elearning developers, chief learning officers and other learning executives, I have been curious to see to what extent this seminal research review has been utilized by other learning professionals. So, for the last year and a half or so, I’ve been asking the audiences I encounter in my keynotes and other conference presentations whether they have encountered this research review.

Often I use the image below to ask the question:

Click here to see original research article…


What would be your guess as to the percentage of folks in our industry who have read this?

10%

30%

50%

70%

90%

Sadly, in almost all of the audiences I’ve encountered, less than 5% of the learning professionals have read this research review.

Indeed, usually more than 95% of workplace learning professionals have “never heard of it” even two years after it was published!!!

THIS IS DEEPLY TROUBLING!

And the slur this dumps on our industry’s most potent institutions should be self-evident. And I, too, must take blame for not being more successful in getting these issues heard.

A Review of the Review

People who are subscribed to my email newsletter (you can sign up here), have already been privy to this review many months ago.

I hope the following review will be helpful, and remember, when you’re gathering knowledge to help you do your work, make sure you’re gathering it from sources who are mindful of the scientific research. There is a reason that civilization progresses through its scientific efforts–science provides a structured process of insight generation and testing, creating a self-improving knowledge-generation process that maximizes innovation while minimizing bias.

——————————-

Quotes from the Research Review:

“It has long been recognized that traditional,
stand-up lectures are an inefficient and
unengaging strategy for imparting
new knowledge and skills.” (p. 86)


“Training costs across organizations remain
relatively constant as training shifts from
face-to-face to technology-based methods.” (p. 87)


“Even when trainees master new knowledge and
skills in training, a number of contextual factors
determine whether that learning is applied
back on the job…” (p. 90)


“Transfer is directly related to opportunities
to practice—opportunities provided either by
the direct supervisor or the organization
as a whole.” (p. 90)


“The Kirkpatrick framework has a number of
theoretical and practical shortcomings…” (p. 91)

Introduction

I, Will Thalheimer, am a research translator. I study research from peer-reviewed scientific journals on learning, memory, and instruction and attempt to distill whatever practical wisdom might lurk in the dark cacophony of the research catacomb. It’s hard work—and I love it—and the best part is that it gives me some research-based wisdom to share with my consulting clients. It helps me not sound like a know-nothing. Working to bridge the research-practice gap also enables me to talk with trainers, instructional designers, elearning developers, chief learning officers, and other learning executives about their experiences using research-based concepts.


It is from this perspective that I have a sad, and perhaps horrifying, story to tell. In 2012—an excellent research review on training was published in a top-tier journal. Unbelievably, most training practitioners have never heard of this research review. I know because when I speak at conferences and chapters in our field I often ask how many people have read the article. Typically, less than 5% of experienced training practitioners have! Less than 1 in 20 people in our field have read a very important review article.


What the hell are we doing wrong? Why does everyone know what a MOOC is, but hardly anyone has looked at a key research article?


You can access the article by clicking here. You can also read my review of some of the article’s key points as I lay them out below.


Is This Research Any Good?

Not all research is created equal. Some is better than others. Some is crap. Too much “research” in the learning-and-performance industry is crap so it’s important to first acknowledge the quality of the research review.

The research review by Eduardo Salas, Scott Tannenbaum, Kurt Kraiger, and Kimberly Smith-Jentsch from November 2012 was published in the highly-regarded peer-reviewed scientific journal, Psychological Science in the Public Interest, published by the Association for Psychological Science, one of the most respected social-science professional organizations in the world. The research review not only reviews research, but also utilizes meta-analytic techniques to distill findings from multiple research studies. In short, it’s high-quality research.


The rest of this article will highlight key messages from the research review.


Training & Development Gets Results!

The research review by Salas, Tannenbaum, Kraiger, and Smith-Jentsch shows that training and development is positively associated with organizational effectiveness. This is especially important in today’s economy because the need for innovation is greater and more accelerated—and innovation comes from the knowledge and creativity of our human resources. As the researchers say, “At the organizational level, companies need employees who are both ready to perform today’s jobs and able to learn and adjust to changing demands. For employees, that involves developing both job-specific and more generalizable skills; for companies, it means taking actions to ensure that employees are motivated to learn.” (p. 77). Companies spend a ton of money every year on training—in the United States the estimate is $135 billion—so it’s first important to know whether this investment produces positive outcomes. The bottom line: Yes, training does produce benefits.


To Design Training, It Is Essential to Conduct a Training Needs Analysis

“The first step in any training development effort ought to be a training needs analysis (TNA)—conducting a proper diagnosis of what needs to be trained, for whom, and within what type of organizational system. The outcomes of this step are (a) expected learning outcomes, (b) guidance for training design and delivery, (c) ideas for training evaluation, and (d) information about the organizational factors that will likely facilitate or hinder training effectiveness. It is, however, important to recognize that training is not always the ideal solution to address performance deficiencies, and a well-conducted TNA can also help determine whether a non-training solution is a better alternative.” (p. 80-81) “In sum, TNA is a must. It is the first and probably the most important step toward the design and delivery of any training.” (p. 83) “The research shows that employees are often not able to articulate what training they really need” (p. 81) so just asking them what they need to learn is not usually an effective strategy.


Learning Isn’t Always Required—Some Information can be Looked Up When Needed

When doing a training-needs analysis and designing training, it is imperative to separate information that is “need-to-know” from that which is “need-to-access.” Since learners forget easily, it’s better to use training time to teach the need-to-know information and prepare people on how to access the need-to-access information.


Do NOT Offer Training if It is NOT Relevant to Trainees

In addition to being an obvious waste of time and resources, training courses that are not specifically relevant to trainees can hurt motivation for training in general. “Organizations are advised, when possible, to not only select employees who are likely to be motivated to learn when training is provided but to foster high motivation to learn by supporting training and offering valuable training programs.” (p. 79) This suggests that every one of the courses on our LMS should have relevance and value.


It’s about Training Transfer—Not Just about Learning!

“Transfer refers to the extent to which learning during training is subsequently applied on the job or affects later job performance.” (p. 77) “Transfer is critical because without it, an organization is less likely to receive any tangible benefits from its training investments.” (p. 77-78) To ensure transfer, we have to utilize proven scientific research-based principles in our instructional designs. Relying on our intuitions is not enough—because they may steer us wrong.


We must go Beyond Training!

“What happens in training is not the only thing that matters—a focus on what happens before and after training can be as important. Steps should be taken to ensure that trainees perceive support from the organization, are motivated to learn the material, and anticipate the opportunity to use their skills once on (or back on) the job.” (p. 79)


Training can be Designed for Individuals or for Teams

“Today, training is not limited to building individual skills—training can be used to improve teams as well.” (p. 79)


Management and Leadership Training Works

“Research evidence suggests that management and leadership development efforts work.” (p. 80) “Management and leadership development typically incorporate a variety of both formal and informal learning activities, including traditional training, one-on-one mentoring, coaching, action learning, and feedback.” (p. 80)


Forgetting Must Be Minimized, Remembering Must Be Supported

One meta-analysis found that one year after training, “trainees [had] lost over 90% of what they learned.” (p. 84) “It helps to schedule training close in time to when trainees will be able to apply what they have learned so that continued use of the trained skill will help avert skill atrophy. In other words, trainees need the chance to ‘use it before they lose it.’ Similarly, when skill decay is inevitable (e.g., for infrequently utilized skills or knowledge) it can help to schedule refresher training.” (p. 84)


Common Mistakes in Training Design Should Be Avoided

“Recent reports suggest that information and demonstrations (i.e., workbooks, lectures, and videos) remain the strategies of choice in industry. And this is a problem [because] we know from the body of research that learning occurs through the practice and feedback components.” (p. 86) “It has long been recognized that traditional, stand-up lectures are an inefficient and unengaging strategy for imparting new knowledge and skills.” (p. 86) Researchers have “noted that trainee errors are typically avoided in training, but because errors often occur on the job, there is value in training people to cope with errors both strategically and on an emotional level.” (p. 86) “Unfortunately, systematic training needs analysis, including task analysis, is often skipped or replaced by rudimentary questions.” (p. 81)


Effective Training Requires At Least Four Components

“We suggest incorporating four concepts into training: information, demonstration, practice, and feedback.” (p. 86) Information must be presented clearly and in a way that enables the learners to fully understand the concepts and skills being taught. Skill demonstrations should provide clarity to enable comprehension. Realistic practice should be provided to enable full comprehension and long-term remembering. Proving feedback after decision-making and skill practice should be used to correct misconceptions and improve the potency of later practice efforts.

The bottom line is that more realistic practice is needed. Indeed, the most effective training utilizes relatively more practice and feedback than is typically provided. “The demonstration component is most effective when both positive and negative models are shown rather than positive models only.” (p. 87)

Will’s Note: While these four concepts are extremely valuable, personally I think they are insufficient. See my research review on the Decisive Dozen for my alternative.


E-Learning Can Be Effective, But It May Not Lower the Cost of Training

“Both traditional forms of training and technology-based training can work, but both can fail as well. (p. 87) While the common wisdom argues that e-learning is less costly, recent “survey data suggest that training costs across organizations remain relatively constant as training shifts from face-to-face to technology-based methods.” (p. 87) This doesn’t mean that e-learning can’t offer a cost savings, but it does mean that most organizations so far haven’t realized cost savings. “Well-designed technology-based training can be quite effective, but not all training needs are best addressed with that approach. Thus, we advise that organizations use technology-based training wisely—choose the right media and incorporate effective instructional design principles.” (p. 87)


Well-Designed Simulations Provide Potent Learning and Practice

“When properly constructed, simulations and games enable exploration and experimentation in realistic scenarios. Properly constructed simulations also incorporate a number of other research-supported learning aids, in particular practice, scaffolding or context-sensitive support, and feedback. Well-designed simulation enhances learning, improves performance, and helps minimize errors; it is also particularly valuable when training dangerous tasks. (p. 88)


To Get On-the-Job Improvement, Training Requires After-Training Support

“The extent to which trainees perceive the posttraining environment (including the supervisor) as supportive of the skills covered in training had a significant effect on whether those skills are practiced and maintained.” (p. 88) “Even when trainees master new knowledge and skills in training, a number of contextual factors determine whether that learning is applied back on the job: opportunities to perform; social, peer, and supervisory support; and organizational policies.” (p. 90) A trainee’s supervisor is particularly important in this regard. As repeated from above, researchers have “discovered that transfer is directly related to opportunities to practice—opportunities provided either by the direct supervisor or the organization as a whole.” (p. 90)


On-the-Job Learning can be Leveraged with Coaching and Support

“Learning on the job is more complex than just following someone or seeing what one does. The experience has to be guided. Researchers reported that team leaders are a key to learning on the job. These leaders can greatly influence performance and retention. In fact, we know that leaders can be trained to be better coaches…Organizations should therefore provide tools, training, and support to help team leaders to coach employees and use work assignments to reinforce training and to enable trainees to continue their development.” (p. 90)


Trainees’ Supervisors Can Make or Break Training Success

Researchers have “found that one misdirected comment by a team leader can wipe out the full effects of a training program.” (p. 83) “What organizations ought to do is provide leaders with information they need to (a) guide trainees to the right training, (b) clarify trainees’ expectations, (c) prepare trainees, and (d) reinforce learning…” (p. 83) Supervisors can increase trainees’ motivation to engage in the learning process. (p. 85) “After trainees have completed training, supervisors should be positive about training, remove obstacles, and ensure ample opportunity for trainees to apply what they have learned and receive feedback.” (p. 90) “Transfer is directly related to opportunities to practice—opportunities provided either by the direct supervisor or the organization.” (p. 90)


Will’s Note: I’m a big believer in the power of supervisors to enable learning. I’ll be speaking on this in an upcoming ASTD webinar.


Basing Our Evaluations on the Kirkpatrick 4 Levels is Insufficient!!!

“Historically, organizations and training researchers have relied on Kirkpatrick’s [4-Level] hierarchy as a framework for evaluating training programs…[Unfortunately,] The Kirkpatrick framework has a number of theoretical and practical shortcomings. [It] is antithetical to nearly 40 years of research on human learning, leads to a checklist approach to evaluation (e.g., ‘we are measuring Levels 1 and 2, so we need to measure Level 3’), and, by ignoring the actual purpose for evaluation, risks providing no information of value to stakeholders… Although the Kirkpatrick hierarchy has clear limitations, using it for training evaluation does allow organizations to compare their efforts to those of others in the same industry. The authors recommendations for improving training evaluation fit into two categories. First, [instead of only using the Kirkpatrick framework] “organizations should begin training evaluation efforts by clearly specifying one or more purposes for the evaluation and should then link all subsequent decisions of what and how to measure to the stated purposes.” (p. 91) Second, the authors recommend that training evaluations should “use precise affective, cognitive, and/or behavioral measures that reflect the intended learning outcomes.” (p. 91)


This is a devastating critique that should give us all pause. Of course it is not the first such critique, nor will it have to be the last I’m afraid. The worst part about the Kirkpatrick model is that it controls the way we think about learning measurement. It doesn’t allow us to see alternatives.


Leadership is Needed for Successful Training and Development

“Human resources executives, learning officers, and business leaders can influence the effectiveness of training in their organizations and the extent to which their company’s investments in training produce desired results. Collectively, the decisions these leaders make and the signals they send about training can either facilitate or hinder training effectiveness…Training is best viewed as an investment in an organization’s human capital, rather than as a cost of doing business. Underinvesting can leave an organization at a competitive disadvantage. But the adjectives “informed” and “active” are the key to good investing. When we use the word “informed,” we mean being knowledgeable enough about training research and science to make educated decisions. Without such knowledge, it is easy to fall prey to what looks and sounds cool—the latest training fad or technology.”  (p. 92)

Thank you!

I’d like to thank all my clients over the years for hiring me as a consultant, learning auditor, workshop provider, and speaker–and thus enabling me to continue in the critical work of translating research into practical recommendations.

If you think I might be able to help your organization, please feel free to contact me directly by emailing me at “info at worklearning dot com” or calling me at 617-718-0767.


As of today, the Learning Styles Challenge payout is rising from $1000 to $5000! That is, if any person or group creates a real-world learning intervention that takes learning styles into account–and proves that such an intervention produces better learning results than a non-learning-styles intervention, they’ll be awarded $5,000!

Special thanks to the new set of underwriters, each willing to put $1000 in jeopardy to help get the word out to the field:

Learning Styles Challenge Rules

We’re still using the original rules, as established back in 2006. Read them here.


What is Implied in This Debunking

The basic finding in the research is that learning interventions that take into account learning styles do no better than learning interventions that do not take learning styles into account. This does not mean that people do not have differences in the way they learn. It just means that designing with learning styles in mind is unlikely to produce benefits–and thus the extra costs are not likely to be a good investment.

Interestingly, there are learning differences that do matter! For example, if we really want to get benefits from individual differences, we should consider the knowledge and skill level of our learners.


What Can You Do to Spread the Word

Thanks to multiple efforts by many people over the years to lessen the irrational exuberance of the learning-styles proliferators, fewer and fewer folks in the learning field are falling prey to the learning-styles myth. But the work is not done yet. This issue still needs your help!

Here’s some ideas for how you can help:

  • Spread the word through social media! Blogs, Twitter, LinkedIn, Facebook!
  • Share this information with your work colleagues, fellow students, etc.
  • Gently challenge those who proselytize learning styles.
  • Share the research cited below.


History of the Learning Styles Challenge

It has been exactly eight years since I wrote in a blog post:

I will give $1000 (US dollars) to the first person or group who can prove that taking learning styles into account in designing instruction can produce meaningful learning benefits.

Eight years is a long time. Since that time, over one billion babies have been born, 72 billion metric tons of carbon pollution have been produced, and the U.S. Congress has completely stopped functioning.

However, not once in these past eight years has any person or group collected on the Learning Styles challenge. Not once!


Research on Learning Styles

However, since 2006, more and more people have discovered that learning styles are unlikely to be an effective way to design instruction.

First, there was the stunning research review in the top-tier scientific journal, Psychological Science in the Public Interest:

Pashler, H., McDaniel, M., Rohrer, D., & Bjork, R. (2008). Learning styles: Concepts and evidence. Psychological Science in the Public Interest, 9(3), 105-119.

The authors wrote the following:

We conclude therefore, that at present, there is no adequate evidence base to justify incorporating learning-styles assessments into general educational practice. Thus, limited education resources would better be devoted to adopting other educational practices that have a strong evidence base, of which there are an increasing number. However, given the lack of methodologically sound studies of learning styles, it would be an error to conclude that all possible versions of learning styles have been tested and found wanting; many have simply not been tested at all. (p. 105)

To read more about what they wrote, click here.

Two years later, two of the authors reiterated their findings in a separate–and nicely written–article for the Association for the Study of Medical Education. You can access that article at: http://uweb.cas.usf.edu/~drohrer/pdfs/Rohrer&Pashler2012MedEd.pdf. Here’s the research citation:

Rohrer, D., & Pashler, H. (2012). Learning styles: Where’s the evidence? Medical Education, 46(7), 634-635.

A researcher who had once advocated for learning styles did an about face after he did some additional research:

Cook, D. A. (2012). Revisiting cognitive and learning styles in computer-assisted instruction: Not so useful after all. Academic Medicine, 87(6), 778-784.
Of course, not everyone is willing to give up on learning styles. For example, Furnham (2012) wrote:
The application of, and research into, learning styles and approaches is clearly alive and well. (p. 77).
Furnham, A. (2012). Learning styles and approaches to learning. In K. R. Harris, S. Graham, T. Urdan, S. Graham, J. M. Royer, & M. Zeidner (Eds.), APA handbooks in psychology. APA educational psychology handbook, Vol. 2. Individual differences and cultural and contextual factors (pp. 59-81). doi:10.1037/13274-003

A quick cursory look–today–through the PsycINFO database shows that scientific published articles on learning styles are still being published.


Learning Styles in the Workplace Learning Field

Guy Wallace, performance analyst and instructional architect, has been doing a great job keeping the workplace learning field up on the learning-styles debate. Check out his article in eLearn Magazine and his blog post update.

You’ll note from Guy’s blog post that many prominent thought leaders in the field have been suspicious of learning styles for many years.


In continuing my dual career–partly as a charismatic and wildly-effective learning consultant and keynote speaker, partly as a grizzled, hermitted researcher and agonizingly-slow book writer (still working on the same book for the last 16 years)–I have started talking publicly about my list of 12 factors that if training developers implemented, would propel their training to divine glory. I call this list “The Decisive Dozen.”

Click here to read a short introduction to the Decisive Dozen

Of course, I get questions. “How does he do it when so many others have perished?” “How does he get his hair to do that?” And my personal favorite, “How the hell does Thalheimer know these are the most critical learning factors?” It’s a fair question, and instead of releasing 12 chapters from my potentially-forthcoming hopefully-not-posthumorous book, I created a little research brief just to show that I’m not making this stuff up. I’m stealing directly from the world’s best learning researchers!

Click to download the Decisive Dozen Research Review

Thanks for your interest in my work!

Clark Quinn (blog, website, Twitter)  recently cited some of my thinking about instructional objectives in the instructional technology forum of AECT (ITFORUM). I wrote a long email to Clark in response, thanking him, and going into more detail. I am reprising my response to Clark here:

In a recent post to this list, Clark Quinn rightly notes that objectives for learners and objectives for instructional designers need not be identical. Indeed, as both Clark and I have previously noted, the probably shouldn’t be identical.

Here’s the thinking: Objectives are designed to guide behavior. So, how can it be that identically-worded objectives can adequately guide the behavior of two disparate groups of individuals (learners and instructional designers)? It just doesn’t make any sense!!

And indeed, Hamilton (1985) found that presenting learners with learning objectives in the way Mager suggested, PRODUCES NO BENEFITS AND MAY BE HARMFUL. Here’s what Hamilton wrote:

“[An instructional] objective that generally identifies the information to be learned in the text will produce robust effects. Including other information (per Mager’s, 1962, definition) will not significantly help and it may hinder the effects of the objectives”

(Hamilton, 1985, p. 78).

Objectives are not only designed to change behavior for a particular set of individuals, but they are also designed with particular purposes in mind—or they should be.

So, when we talk of instructional objectives, we also need to think about what purpose we have for them.

The quote above from Hamilton is focused on how well learning objectives focus the attention of learners. Interestingly, this is the only area in which extensive research has been done on learning objectives. You might be surprised to know that learning objectives help learners focus on the information targeted by learning objectives, but actually diminish their attention on information in the learning materials not targeted by learning objectives. For example, in two experiments using specific objectives, Rothkopf and Billington (1979) found that when focusing objectives were provided to learners, performance on material related to the objectives improved by 49% and 47% over situations when focusing objectives were not used. However, the material not related to the learning objectives was learned 39% and 33% WORSE than it would have been if no learning objectives were used!

These types of instructional objectives—presented to learners prior to subsequent learning—I call “focusing objectives” because they are designed for the purpose of focusing learner attention on critical learning material. As the Hamilton (1985) review pointed out, it does NOT help to add Mager’s criterion information to focusing objectives, because it doesn’t help learners focus on the critical material.

NOW, here’s an important point (I say to focus your attention):  We don’t necessarily need to use focusing objectives with learners if we have other means to focus their attention!! We can use a relevant, gripping story. We can do a shout-out (example, “Here’s an important point…”). We can have them attempt to answer a relevant scenario-based question and struggle with it. Etcetera.

Here’s another important point: Focusing objectives are only one type of objective we might want to utilize. I have a whole list, and I’m sure you can think of more of them.

Instructional Objectives for Learners:

  1. Table-of-Contents Objectives
    To give learners a big picture sense of what will be taught.
  2. Performance Objectives
    To let learners know what performance will be expected of them.
  3. Motivation Objective
    To ensure learners know why they might be motivated to engage the learning or application of the learning.
  4. Focusing Objective
    To guide learner attention to the most critical information in the learning material.

Instructional Objectives for Developers:

  1. Instructional-Design Objective
    To guide developers toward the ultimate goal of the learning intervention.
  2. Evaluation Objective
    To guide developers (and other stakeholders) to the ultimate measurable outcomes that the learning intervention will be measured by.
  3. Situation Objectives
    To guide developers to the situations that learners must be prepared for.
  4. Organization Objective
    To guide developers to the organizational effects targeted by the instruction.


Questions:

So, here’s some questions for you:

Is it okay to use the word understand in an “instructional-design objective”?

How about in a “focusing objective”?

Answer: It’s okay to use the word understand in a focusing objective—because it does not hurt the learner in setting them up to focus attention on critical concepts. But it is NOT okay to use the word understand in an instructional-design objective—because the word “understand” doesn’t have enough specificity to guide instructional design.

My point in asking these questions is to show that over-simplistic notions about instructional objectives are likely to be harmful to your instructional designs.

As usual, the research helps us see things we wouldn’t otherwise have seen.

Hope this helps!!

= Will


Will’s Note:

References

Hamilton, R. J. (1985). A framework for the evaluation of the effectiveness of adjunct questions and objectives. Review of Educational Research, 55, 47-85.

Mager, R. (1962). Preparing Instructional Objectives. Palo Alto, CA: Fearon Publishers.

Rothkopf, E. Z., & Billington, M. J. (1979). Goal-guided learning from text: Inferring a descriptive processing model from inspection times and eye movements. Journal of Educational Psychology, 71(3), 310-327.

I set out over 15 years ago to come up with a short list of the most important learning factors based on scientific research and practical real-world wisdom. I felt at the time, and I believe even more strongly now, that the learning field–particularly the workplace learning-and-performance field–is too strongly tempted to jump from one learning fad to another, while ignoring the learning factors that are most important.

My original goal was to create a list that had no more than seven learning factors. I did extensive reviews of a wide swath of the research on learning, memory, and instruction; often doing comparative effect-size analyses to determine what factors were most important. As the years went by and blurred into the second decade of work, I more and more looked at the research from a practical perspective, hoping to find the factors that were not just the most potent, but also the most leveragable by real-world instructional designers, trainers, teachers, e-learning developers, etc.In the end, I failed to find only seven factors, but found 12 that seem extraordinarily potent and leveragable.

Obviously, to pick the most important learning factors is a difficult endeavor–and one subject to a significant degree of human judgment, of which some of mine is surely faulty. Still, all along the way, I have not lost my strong belief that coming up with a short list of learning factors based on the world’s best scientific research from peer-reviewed refereed journals would be extremely helpful in keeping us focused on the factors that matter the most. At a minimum, I feel the list I have created will help most of us create remarkably more effective learning interventions.

In the current version of my book draft, I say the following:

If you put all 12 of these factors into practice, your learning interventions are
likely to be more effective than 95% of all workplace learning interventions
currently being utilized!!

This is quite a bold statement, I know. But I’m very comfortable in making it. In the book I provide a detailed footnote explaining the evidence behind the statement, and maybe an editor will convince me not to be so bold (maybe push me down to 93%, for example–SMILE), but I really do think that most learning interventions in the workplace learning field are lacking significant effectiveness.

Also in the book, each of the 12 factors has its own chapter, often dozens of pages long, backed up by dozens of research studies, and dozens of practical implications and recommendations. Dozens to the max! Obviously, the short descriptions in the synopsis below cannot even approach doing these topics justice. Still, they may provide you with a good framework to enable you to begin to see your learning designs in a different light.

The Decisive Dozen

Because I have shared the Decisive Dozen with clients and in keynote addresses and conference speeches for the last year or so, I decided that it was time to make the list officially public.

Click here to download a brief synopsis of the Decisive Dozen

I welcome your comments and feedback.

And, of course, for those who can’t wait for the book (I can’t blame you, I’m taking a long time, aren’t I?), I would be delighted to discuss with you how the Decisive Dozen might be helpful in guiding your organization to greater learning effectiveness.

Update: Now you can check out a research review supporting the Decisive Dozen.

Click here to get access to the free research review

Despite decades of advocacy by our best trade associations, our wisest gurus, and our most practical researchers, most organizations today still rely on training courses that have little impact in promoting on-the-job performance.

As I mentioned in a recent article, we as learning professionals continue to fail in five major ways. You can access that article by clicking here.

I used to think that this was just a failure of knowledge, but in most of the organizations in which I’ve consulted, there are at least a few learning-and-performance professionals who understand that training alone is not enough. Part of the problem is the dead weight of tradition–the “old normal” continues to blind us to new possibilities. The enlightened few have a hard time pushing back against the gravitational pull of this mass hypnosis.

I recently had a new insight–a way of looking at this problem that I think might enable organizations to break out of their bad habits. The solution is that we have to gain control of the leverage points we have to push for change. We have to change the levers that warp and control our thinking. The big lever is learning measurement. I’ve been pushing this for years as our most important leverage point. If we measured better, we’d get better feedback, which would push us to create better learning interventions.

But learning measurement isn’t our only lever and changing your learning measurement practices is not always easy politically. Beside learning measurement, I’ve compiled a whole list of other leverage points that  really matter. In fact, it was only recently that I had this incredible insight (one I maybe should have had 10 years ago), that we ought to figure out all the levers we have at our disposal and change them to help push our organizations toward a performance orientation. I’d like to reveal one of those levers today.

One of the things we do in our organizations is review our training courses from time to time–either intentionally or by osmosis and feeling. Well, instead of using the wrong metrics, why not use methods that we know–based on our understanding of learning-and-performance–are likely to be good indicators of whether our training course will support actual on-the-job performance.

The Course Review Template is something that can be used on any training course–classroom training or e-learning.It includes a set of questions that are indicators of how performance-based your training course is. Each rubric in this tool is inspired by research or proven practices which I’ve learned in my 25+ years in the workplace learning field.

I should give you a warning. You’re unlikely to be happy with what you find. If I bet each of you one dollar for each training course of yours that doesn’t support performance, I’d be a millionaire overnight.

But to be fair, I’m going to let you try out the tool yourself. It’s free. Use it. And, let me know how your training courses rate. Are they likely to improve on-the-job performance or not?

Click to Download the Course Review Template

After you review a course, post your results at the following link, and when we get enough responses, we’ll let you compare your results to others.

Click to Post Your Course Review Results — SORRY, we’re done collecting data in a survey format.

Maybe I’m having a momentary bout of delusional cognition, but I’m thinking right now that this simple Course Review Template might just revolutionize our ability to simply review our courses to see how performance focused they are.

Such a grandiose statement will provoke eye rolls in some, so let me stipulate a few things. First, this is a first draft, so the Course Review Template is going to be imminently improvable. Second, the Course Review Template is NOT a precision instrument. It is not psychometrically derived, the numbers it assigns to each rubric are best guesses, and there was no super-committee here–just me. Third, the rubrics themselves are subject to interpretation. Instead of over-complicating the form and making it unusable, I decided to keep it simple and make it less precise. Finally, course reviews are just one of the levers you’ll need to completely transition from a course-focus to a performance-focus.

The bottom line is that we have to try some innovate new things to push our organizations to a performance focus. The old ways have not worked. The Course Review Template–or something like it–is worth a try. And seriously, I think it could revolutionize the way your organization views its training courses.

NOTE 2017: While this is the original blog post, it now includes the latest version of the Course Review Template. A later post that introduced the improvements is available here.


This blog post is excerpted from the full report, How Much Do People Forget? Click here to download the full report. You may also access the report—and many other reports—by going to my catalog page by clicking here.

Everybody Wants to Know—How Much Do People Forget?

For years, people have been asking me, “How much do people forget?” and I’ve told them, “It depends.” When I make this statement, most people scowl at me and walk away frustrated and unrequited. I also suspect that some of them think less of me—perhaps that I am just hiding my ignorance.

But I try. I try to explain the complexity of human learning. I explain that forgetting depends on many things, for example:

  • The type of material that is being learned
  • The learners’ prior knowledge
  • The learners’ motivation to learn
  • The power of the learning methods used
  • The contextual cues in the learning and remembering situations
  • The amount of time the learning has to be retained
  • The difficulty of the retention test
  • Etc.

More meaningful materials (like stories) tend to be easier to remember than less meaningful material (like nonsense syllables). More relevant concepts tend to be easier to remember than less relevant concepts. Learners who have more prior knowledge in a topic area are likely to be better able to remember new concepts learned in that area. More motivated learners are more likely to remember than less motivated learners. Learners who receive repetitions, retrieval practice, feedback, variety (and other potent learning methods) are more likely to remember than learners who do not receive such learning supports. Learners who are provided with learning and practice in the situations where they will be asked to remember the information will be better able to remember. Learners who are asked to retrieve information shortly after learning it will retrieve more than learners who are asked to retrieve information a long time after learning it.

I try to explain all this, but still people keep asking.

And then there are the statistics I keep hearing—that are passed around the learning field from person to person through the years as if they were immutable truths carved by Old Moses Ebbinghaus on granite stones. Here is some information so cited (as of December 2010):

  • People forget 40% of what they learned in 20 minutes and 77% of what they learned in six days (http://www.festo-didactic.co.uk/gb-en/news/forgetting-curve-its-up-to-you.htm?fbid=Z2IuZW4uNTUwLjE3LjE2LjM0Mzc).
  • People forget 90% after one month. (http://www.reneevations.com/management/ebbinghaus-curve/)
  • People forget 50-80% of what they’ve learned after one day and 97-98% after a month. (http://www.adm.uwaterloo.ca/infocs/study/curve.html)

Never mind that these immutable truths conflict with each other.

So, I will try one more time to convince the world that forgetting depends.

To accomplish this, I explored 14 research articles, examining 69 conditions to see how much forgetting occured, representing over 1,000 learners.

The following graph details the amount of forgetting for each of the 69 conditions:


Conclusions

This graph and the indepth analysis in the full article revealed four critical concepts in human learning—truths that every learning professional should deeply understand.

  1. The amount a learner will forget varies depending on many things. We as learning professionals will be more effective if we make decisions based on a deep understanding of how to minimize forgetting and enhance remembering.
  2. Rules-of-thumb that show people forgetting at some pre-defined rate are just plain false. In other words, learning gurus and earnest bloggers are wrong when they make blanket statements like, “People will forget 40% of what they learned within a day of learning it.”
  3. Learning interventions can produce profound improvements in long-term remembering. In other words, learning gurus are wrong when they say that training is not effective.
  4. Different learning methods produce widely different amounts of forgetting. We as learning professionals can be more effective if we take a research-based approach and utilize those learning methods that are most effective.

Telling Findings From the Research

  1. People in the reviewed experiments forgot from 0% to 94% of what they had learned. The bottom line is that forgetting varies widely.
  2. Even within a restricted time range, learners forgot at wildly differing rates. For example, in the 1-2 day range, learners forgot from 0 to 73%. Learners in the 2-8 year range forgot from 16% to 94%. The obvious conclusion here is that learning varies widely (and wildly) and cannot be predetermined (except perhaps by deities, of whom, I think, we have not even a few in the learning field). To be specific, when we hear statements like, “People will forget 60% of what they learned within 7 days,” we should ignore such advice and instead reflect on our own superiority and good looks until we are decidedly pleased with ourselves.
  3. Even when we looked at only one type of learning material, forgetting varied widely. For example, in Bahrick’s classic 1979 experiment where learners were learning English-Spanish word pairs, learners forgot from 12% to 63%. Even more remarkably, if we include those cases where learners actually remembered more on the second test than the first test, learners’ “forgetting” varied from -41% to 63%, a swing of 104 percentage points! Again, we must conclude that forgetting varies widely.
  4. Many of the experiments reviewed in this report showed clearly that learning methods matter. For example, in the Bahrick 1979 study, the best learning methods produced an average forgetting score of -29% forgetting, whereas the worst learning methods produced forgetting at 47%, a swing of 76% points. In Runquist’s 1983 study, the best learning method produced average forgetting at 34%, whereas all the other learning methods produced average forgetting of 78%. In Allen, Mahler, and Estes’ 1969 experiment, the learners given the best learning methods forgot an average of 2.3%, whereas the learners who got middling learning methods forgot an average of 14.3%, and learners given the worst learning methods forgot approximately 21.7%. The bottom line is that the learning methods we choose make all the difference!!

Check out the full report to learn more about the following:

  • What you should do as a learning professional (in light of these findings).
  • Whether the learning-curve notion still applies.
  • What wisdom each of the 14 research articles revealed.
  • The methodology used in the research.
  • The calculation of forgetting.


The Neon Elephant Award

The Neon Elephant Award is awarded to a person, team, or organization exemplifying enlightenment, integrity, and innovation in the field of workplace learning and performance. Announced in December—during the time of year when the northern hemisphere turns away from darkness toward the light and hope of warmer days to come—the Neon Elephant Award honors those who have truly changed the way we think about the practice of learning and performance improvement. Award winners are selected for demonstrated success in pushing the field forward in significant paradigm-altering ways while maintaining the highest standards of ethics and professionalism. 


Why “Neon Elephant?”

The elephant represents learning, power, strength, and the importance of nurturing the community. The glow of neon represents enlightenment, illumination, and a spark of something unique and alluring.


Selection Methodology

The award is based purely on merit and the criteria detailed above. Proposals are not accepted, nor are any entrance fees solicited or accepted. While advice on the selection is sought from industry thought leaders, Dr. Will Thalheimer of Work-Learning Research is the final arbiter. Awards will only be made in years when exceptional contributions to the workplace learning and performance field are apparent.


Winners

The 2025 Neon Elephant Award was awarded to Matt Beane for writing the book, The Skill Code: How to Save Human Ability in the Age of Intelligent Machines—and for his many years researching how humans do work interacting with machines and the people with whom they work.

The 2024 Neon Elephant Award was awarded to Mary C. Murphy and Julie Dirksen—Mary for writing the book, Cultures of Growth: How the New Science of Mindset Can Transform Individuals, Teams, and Organizations; and for Julie for writing the book, Talk to the Elephant: Design Learning for Behavior Change—and for their many contribution to research and research translation.

The 2023 Neon Elephant Award was awarded to Annie Murphy Paul for writing the book The Extended Mind: The Power of Thinking Outside the Brain—and for her lifetime of work bringing research wisdom to light through her books, journalism, writing, and speaking.

The 2022 Neon Elephant Award was awarded to Donald Clark for writing the book Learning Experience Design: How to Create Effective Learning that Works and for the Great Minds On Learning webcast and podcast done in collaboration with John Helmer—and for his tireless work of many years advocating for research-based learning designs and effective innovations in learning technology.

The 2021 Neon Elephant Award was awarded to Clark Quinn and Patti Shank—to Clark Quinn for writing the book, Learning Science for Instructional Designers and Patti Shank for writing the book Write Better Multiple-Choice Questions to Assess Learning—and for their many years translating learning research into practical recommendations.

The 2020 Neon Elephant Award was awarded to Mirjam Neelen and Paul Kirschner for writing the book, Evidence-Informed Learning Design: Use Evidence to Create Training Which Improves Performance—and for their many years publishing their blog 3-Star Learning Experiences.

The 2019 Neon Elephant Award was awarded to David Epstein for writing the book Range: Why Generalists Triumph in a Specialized World, and for his many years as a journalist and science-inspired truth teller.

The 2018 Neon Elephant Award was awarded to Clark Quinn for writing a book debunking the learning myths, Millennials, Goldfish & Other Training Misconceptions: Debunking Learning Myths and Superstitions—and for his many years advocating for research-based practices in the workplace learning field.

The 2017 Neon Elephant Award was awarded to Patti Shank for writing and publishing two research-to-practice books this year, Write and Organize for Deeper Learning and Practice and Feedback for Deeper Learning—and for her many years advocating for research-based practices in the workplace learning field.

The 2016 Neon Elephant Award was awarded to Pedro De Bruyckere, Paul A. Kirschner, and Casper D. Hulshof for their book Urban Myths about Learning and Education—a book that provides a research-based reality check on the myths and misinformation that float around the learning field.

The 2015 Neon Elephant Award was awarded to Julie Dirksen for her book, Design for How People Learn—a book that wonderfully conveys practical, research-based wisdom through the authentic voice of an experienced instructional designer and strategist.

The 2014 Neon Elephant Award was awarded to Peter C. Brown, Henry L. Roediger III, and Mark A. McDaniel for their book, Make it Stick: The Science of Successful Learning—a book that brilliantly conveys scientific principles of learning in prose that is easy to digest, comprehensive and true in its recommendations, highly-credible, and impossible to ignore or forget.

The 2013 Neon Elephant Award was awarded to Gary Klein for his many years doing research and practice in naturalistic decision making, cognitive task analysis, and insight learning–and for reminding us that real-world explorations of human behavior are essential in enabling us to distill key insights.

The 2012 Neon Elephant Award was awarded to K. Anders Ericsson for his many years conducting research on expertise and creating a body of knowledge that has inspired many others to translate his research into recommendations for use by performance-improvement professionals.

The 2011 Neon Elephant Award was awarded to Jeroen van Merriënboer for his many years conducting research on learning and translating that research into practical models for use by learning professionals.

The 2010 Neon Elephant Award was awarded to Richard E. Clark for his many years in leading the workplace learning-and-performance field by bridging the gap between academic research and practical application.

The 2009 Neon Elephant Award was awarded to Ruth Clark for her many years in leading the workplace learning-and-performance field with research-based insights and recommendations, and—by so doing—helping to professionalize our field.

The 2008 Neon Elephant Award was awarded to Robert Brinkerhoff for developing the Success Case evaluation method and for advocating that learning professionals play a more “courageous” role in their organizations.

The 2007 Neon Elephant Award was awarded to Sharon Shrock and Bill Coscarelli for advocating against the use of memorization-level questions in learning measurement and for the use of authentic assessment items, including scenario-based questions, simulations, and real-world skills tests.

The 2006 Neon Elephant Award was awarded to Cal Wick of the Fort Hill Company for his work developing methodologies and software to support learning transfer.